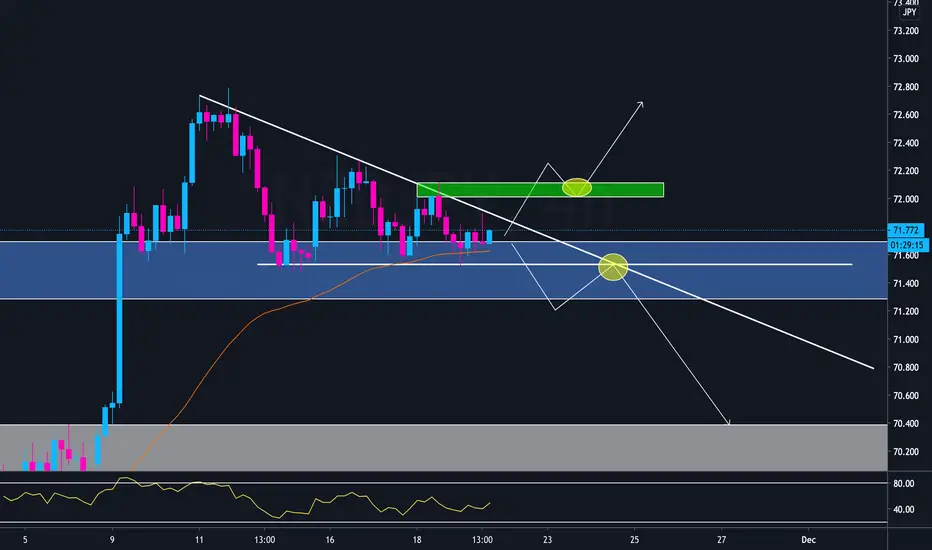
NZDJPY is showing a descending triangle formation at a key area of resistance. When we zoom out to the weekly, we can see the previous weekly candle showed a rejection of this zone and the current weekly candle is showing low bullish momentum. This pair has more potential to breakout to the downside rather than the upside but the market can do whatever it wants. For sells i'll be looking for a break of support and a retest, for buys i'll look for a break and retest of resistance.
Disclaimer
The information and publications are not meant to be, and do not constitute, financial, investment, trading, or other types of advice or recommendations supplied or endorsed by TradingView. Read more in the Terms of Use.
Disclaimer
The information and publications are not meant to be, and do not constitute, financial, investment, trading, or other types of advice or recommendations supplied or endorsed by TradingView. Read more in the Terms of Use.