NZDJPY: Potential Triple Bottom Pattern Could Push Pair Up to 91
NZDJPY: Potential Triple Bottom Pattern Could Push Pair Up to 91.85
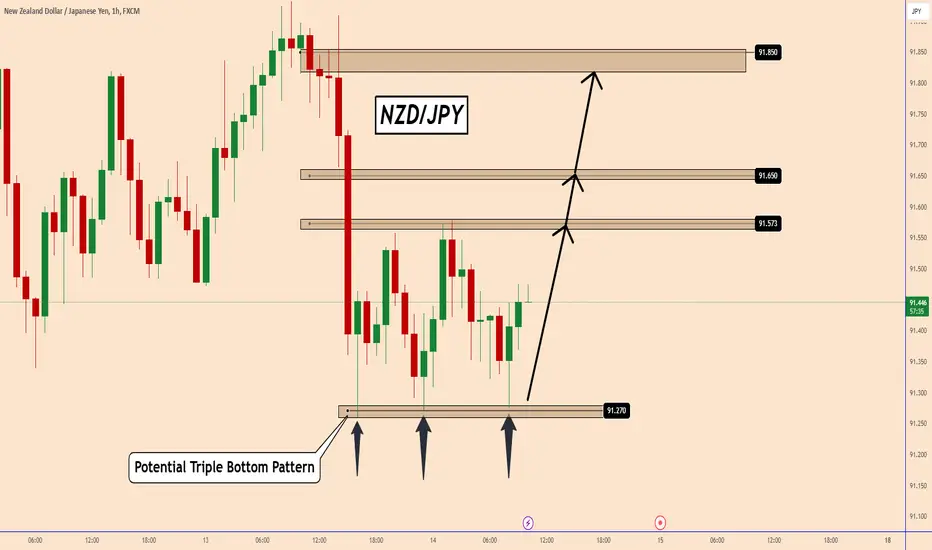
On the 60-minute chart, NZDJPY has found strong support near 91.27. The price has tested this zone three times and reacted near the zone, increasing the chances for another bullish wave.
It looks like NZDJPY may soon confirm a triple bottom pattern. If that happens, NZDJPY may test the top again near 91.85.
You may find more details in the chart!
Thank you and Good Luck!
❤️PS: Please support with a like or comment if you find this analysis useful for your trading day❤️
Trade closed: target reached
✅MY Free Signals
t.me/TradingPuzzles
✅Personal Telegram
t.me/KlejdiCuni
✅YouTube
youtube.com/@TradingPuzzles
t.me/TradingPuzzles
✅Personal Telegram
t.me/KlejdiCuni
✅YouTube
youtube.com/@TradingPuzzles
Disclaimer
The information and publications are not meant to be, and do not constitute, financial, investment, trading, or other types of advice or recommendations supplied or endorsed by TradingView. Read more in the Terms of Use.