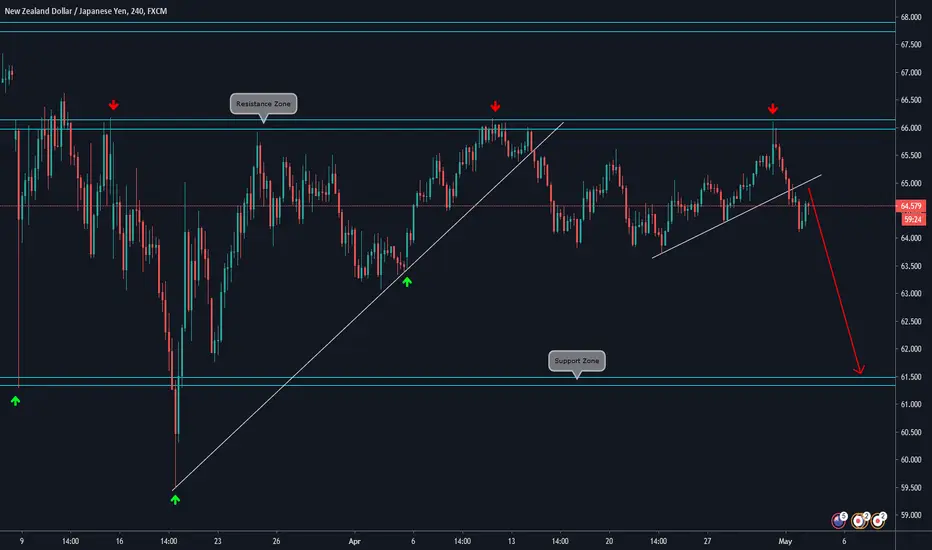
🔸 4H CHART EXPLANATION:
.
.
🔸 Price tried to break the Resistance Zone multiple times, but it couldn't.
.
🔸 We observe that the Ascending Trendline has been broken, and price has been moving sideways since then.
.
🔸 It has broken the 4H Structure to the downside last night, so, we consider that there is bearish potential here.
.
🔸 Will look for a lower timeframe bearish setup.
🔸 DAILY CHART ANALYSIS:

.
.
🔸 Price tried to break the Resistance Zone multiple times, but it couldn't.
.
🔸 We observe that the Ascending Trendline has been broken, and price has been moving sideways since then.
.
🔸 It has broken the 4H Structure to the downside last night, so, we consider that there is bearish potential here.
.
🔸 Will look for a lower timeframe bearish setup.
🔸 DAILY CHART ANALYSIS:
Disclaimer
The information and publications are not meant to be, and do not constitute, financial, investment, trading, or other types of advice or recommendations supplied or endorsed by TradingView. Read more in the Terms of Use.
Disclaimer
The information and publications are not meant to be, and do not constitute, financial, investment, trading, or other types of advice or recommendations supplied or endorsed by TradingView. Read more in the Terms of Use.