Hi every one,
just an idea i am not a pro i tried to explain all the things in the chart ,
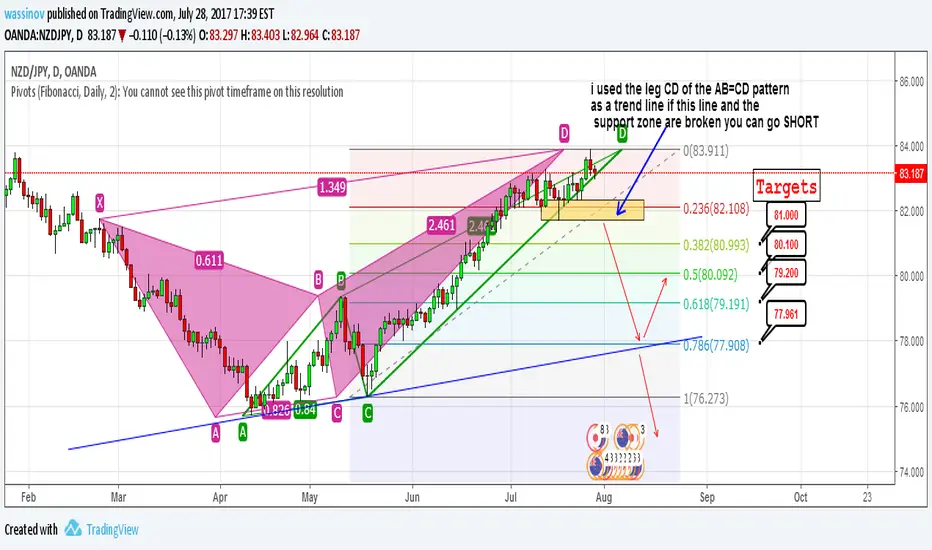
i see 2 harmonic patterns a bearish BAT and a bearish AB=CD,
time frame is Daily or 4H, targets are Fibonacci levels.
any suggestions are welcome, 2,3 minds or more are better than one :-)
thanks
just an idea i am not a pro i tried to explain all the things in the chart ,
i see 2 harmonic patterns a bearish BAT and a bearish AB=CD,
time frame is Daily or 4H, targets are Fibonacci levels.
any suggestions are welcome, 2,3 minds or more are better than one :-)
thanks
Trade active
the trade is active nowTrade closed: target reached
target 1 reachedTrade closed: target reached
target 2 & 3 reached. congrats.Disclaimer
The information and publications are not meant to be, and do not constitute, financial, investment, trading, or other types of advice or recommendations supplied or endorsed by TradingView. Read more in the Terms of Use.
Disclaimer
The information and publications are not meant to be, and do not constitute, financial, investment, trading, or other types of advice or recommendations supplied or endorsed by TradingView. Read more in the Terms of Use.