Upward trend on the daily chart.
Stochastic Indicator approaches the Overbought upper value.
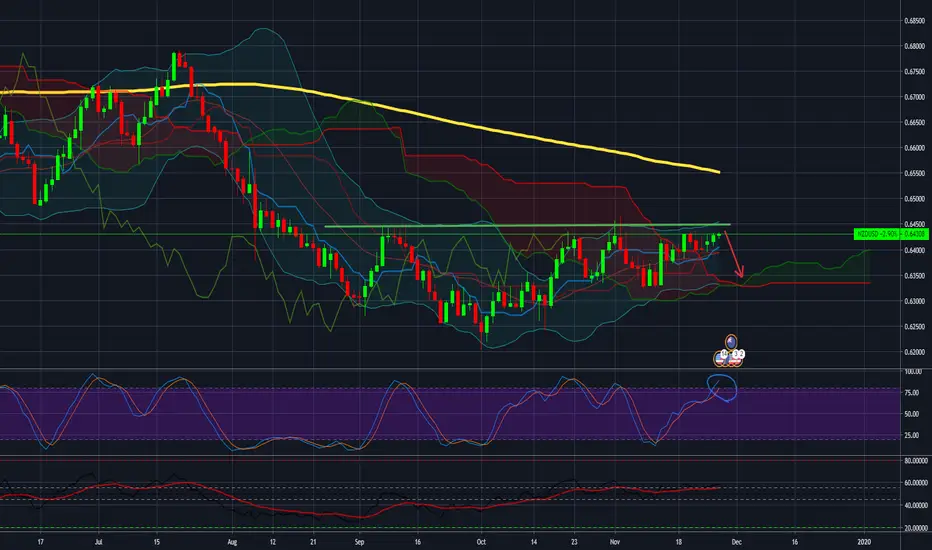
We have drawn a resistance line at 0.6450 in the graph above as you can see the nzdusd has trouble breaking the above line.
Buy only having a resistance line break
By then Sell with a target of 0.6330
Stochastic Indicator approaches the Overbought upper value.
We have drawn a resistance line at 0.6450 in the graph above as you can see the nzdusd has trouble breaking the above line.
Buy only having a resistance line break
By then Sell with a target of 0.6330
Disclaimer
The information and publications are not meant to be, and do not constitute, financial, investment, trading, or other types of advice or recommendations supplied or endorsed by TradingView. Read more in the Terms of Use.
Disclaimer
The information and publications are not meant to be, and do not constitute, financial, investment, trading, or other types of advice or recommendations supplied or endorsed by TradingView. Read more in the Terms of Use.