NZD/USD4H Chart Analysis Bullish Reversal Setup from Demand Zone
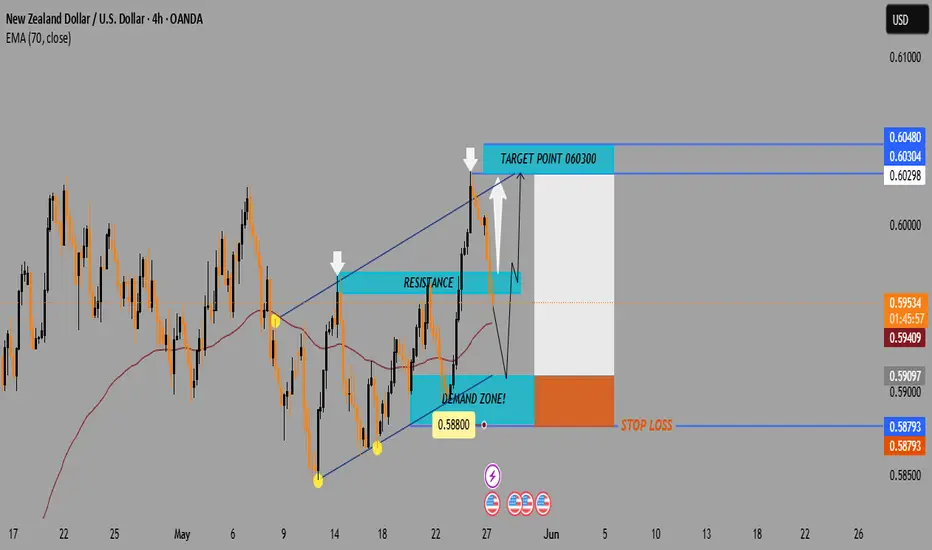
📈 Price: 0.59552
📊 EMA 70: 0.59410 (🟤 Brown Line)
Chart Zones & Key Levels
🔷 Resistance Zone:
🔼 Around 0.60298 – 0.60304
🔹 Price reacted strongly here (🔽 white arrows)
🔹 Acts as a ceiling for now
🟢 Demand Zone:
🔽 Around 0.58800
✅ Buyers stepped in here before
📉 If price drops again, might bounce from here
🟥 STOP LOSS:
❗ 0.58793
🔸 Protects from deeper losses if trend breaks down.
TRADE IDEA
1️⃣ Entry Idea: Wait for a pullback into the Demand Zone
📉⬇️
2️⃣ Bullish Reversal Expected:
⬆️ Bounce toward Target Zone
🎯 Target Point: 0.60300
🟦 Profit zone marked in blue
💸 Good Risk/Reward ratio.
Indicators & Pattern
📐 Wedge Pattern:
🔹 Bullish breakout potential
🔹 Currently respecting the channel
📉 EMA Crossover Area:
🔸 Could act as dynamic support/resistance
🟤 Price hovering around EMA (0.59410)
Summary:
✅ Buy Setup if price holds above 0.58800
🎯 Target: 0.60300
🛑 Stop Loss: 0.58793
⚠️ Watch the price reaction at the Demand Zone for confirmation!
join my tellegram channel
t.me/JaMesGoldFiGhteR786
join my refferal broker
one.exnesstrack.org/a/g565sj1uo7?source=app
t.me/JaMesGoldFiGhteR786
join my refferal broker
one.exnesstrack.org/a/g565sj1uo7?source=app
Disclaimer
The information and publications are not meant to be, and do not constitute, financial, investment, trading, or other types of advice or recommendations supplied or endorsed by TradingView. Read more in the Terms of Use.