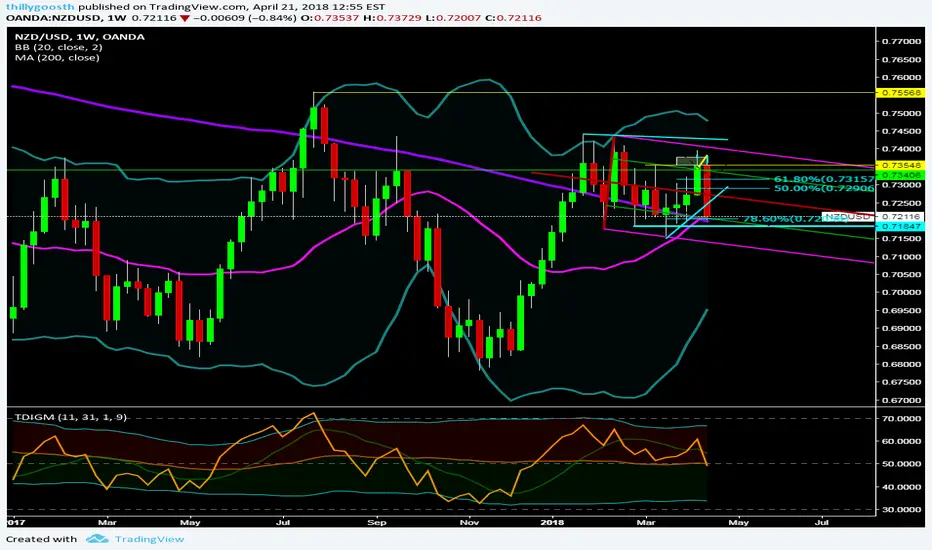
I will most likely be looking to trade NU this week.... It is at the 200 MA crossing with the mid bollinger band (20 MA) on the weekly, at the 78% retrace and a 50% fib pitchfork line... So strong level. I would have to post some different time frames. I pointed out the bull trap at the top and mentioned the possibility of it breaking the low for the 7 swing. I think that's still a possibility. I would like to see the weekly candle start out by the 1 hr chart pushing down making some more overlapping price action, then I would consider taking a buy setup, but anticipating a possible sell setup occurring. You basically have a lot of MA's coming together on the weekly and the daily here. And keep in mind they don't usually just shoot off the 20 on the weekly, but wick below it first. Hard to try explain, but I don't see it as breaking all the way to the downside or upside yet, but possibly breaking the low in a 3 wave structure, which could possibly provide a decent buy this week that may retrace 50-62%, but if price goes up non aggressively and makes a flag, I'll take the sell and look to break the low. If I have time I will post a short video on my channel and go through the levels and different time frames. So, put a 20, 50, 100, and 200 MA on and start on the weekly and click down to 4 hr and have a look.
Disclaimer
The information and publications are not meant to be, and do not constitute, financial, investment, trading, or other types of advice or recommendations supplied or endorsed by TradingView. Read more in the Terms of Use.
Disclaimer
The information and publications are not meant to be, and do not constitute, financial, investment, trading, or other types of advice or recommendations supplied or endorsed by TradingView. Read more in the Terms of Use.