This is a strategy that has been in development for a week or two, no trades placed yet, this is the first.
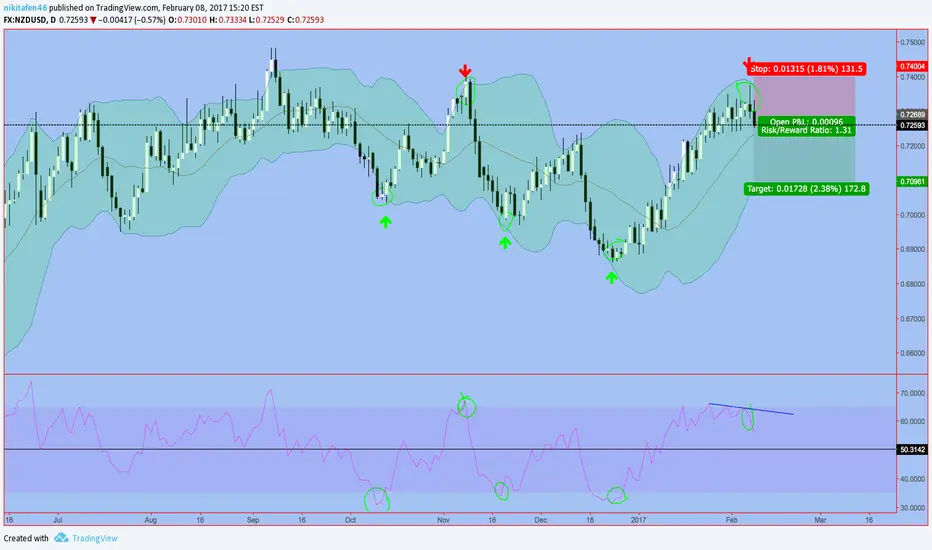
You can see that pattern, RSI breaks out above 65 and goes back down below 65 for several markers, while price is in the upper bollinger band (or near it), and price will go down.
Likewise, RSI breaks out below 35 and goes back up above 35 for several markets, while price is in the lower bollinger band (or near it), and price will go up.
Stop loss above the high, target at the middle band or the opposite band, you pick.
Note
TP moved down to 0.7010, SL moved down to 0.7345, it will go down this weekNote
Target hit, remember this strategy only seems to be working on NZDUSD lol.Disclaimer
The information and publications are not meant to be, and do not constitute, financial, investment, trading, or other types of advice or recommendations supplied or endorsed by TradingView. Read more in the Terms of Use.
Disclaimer
The information and publications are not meant to be, and do not constitute, financial, investment, trading, or other types of advice or recommendations supplied or endorsed by TradingView. Read more in the Terms of Use.