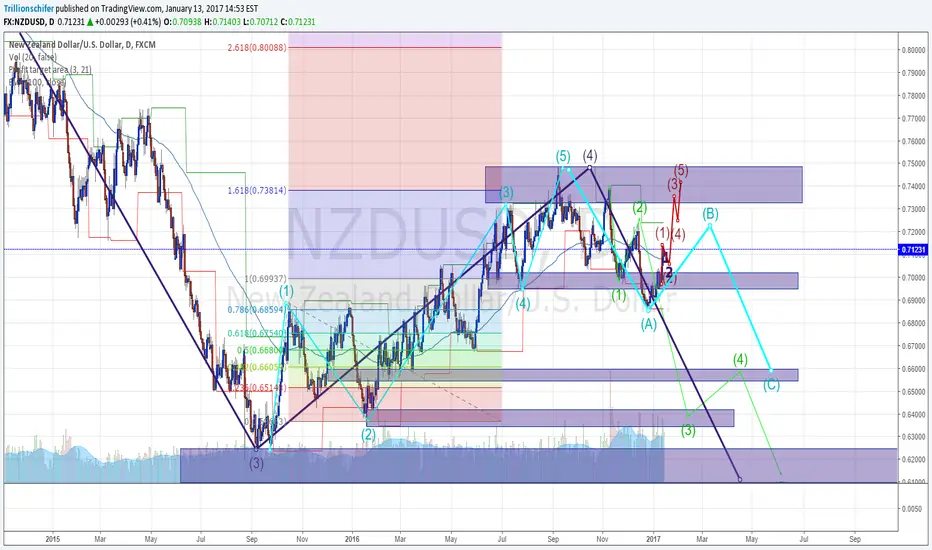
Okay, here is how I see it.
This pattern is WICKED... very very WICKED... It has oversized adjustment EVERYwhere, and that could cause miscounts for E wave traders like myself.
Look at the blue 1 and 2 for example... W.T. H right? But to me that is 1 and 2. Because doing it any other way will cause the bottom of 2 to go lower than 1, leading to 'invalid' patterns.
But as for pattern lets get to it....
The Purple line represents the WEEKLY path. That on an Elliot-Wave is 4 to 5. Of that i am 95% certain.
The green line represents a DAILY Ewave pattern that should end where the Weekly does, in a matter of months. Of that I am 50% certain.
The Red line is a possible Ewave forming, showing that the 4 of the Weekly was not ready to come down yet, and is making one last thrust up, before coming down for the weekly 4 to 5, and to create a new DAILY, 12345 of its own... Erasing the current green line. Of that I am 70% certain.
But the Blue A, B, C I have mixed feelings about... A to B I feel 80% certain about. B may go to the 'red' 5 area. Causing a flat correction. But C.... I don't know how that will behave exactly... It may do this, or something else entirely... only time will tell.
For now... this trade is a short term LONG.
Trade active
Going with the red line for now....Trade active
HONESTLY... ... ... You could close your eyes to ever line here, and just put in a sell and comeback in a month to see what happened to it. LOLTrade active
Looks like going red was the right choice... up 102pips.Trade active
SWITCH: From Red to BLUE... this is now an ABC Bto CTrade active
NOW... go bk to red. Still a buy.Disclaimer
The information and publications are not meant to be, and do not constitute, financial, investment, trading, or other types of advice or recommendations supplied or endorsed by TradingView. Read more in the Terms of Use.
Disclaimer
The information and publications are not meant to be, and do not constitute, financial, investment, trading, or other types of advice or recommendations supplied or endorsed by TradingView. Read more in the Terms of Use.
