Technical Analysis:
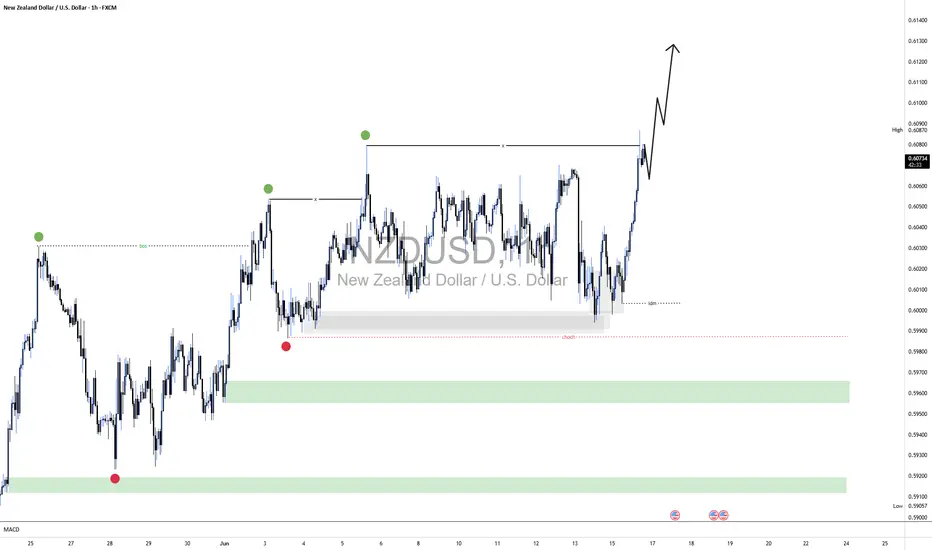
Initial Structure Shift: The chart reveals a significant low in late May, followed by a decisive break of structure (BOS) above a prior high (near the first green dot). This confirms a bullish market transition, indicating strong buying pressure.
Change of Character (CHOCH) Confirmation: The subsequent rally, marked by a sharp upward move, solidifies the change of character, with price sustaining above the BOS level. This reflects institutional intent to drive the market higher.
Resistance Zone Identification: Price has now approached a critical resistance level near 0.6090 (dashed line), where it has tested equal highs multiple times. This zone represents a potential pivot point for supply to emerge.
Momentum and Consolidation: The recent steep ascent, highlighted by the upward arrow, demonstrates robust momentum. However, the tightening of price action near resistance suggests a consolidation phase, offering a strategic entry opportunity.
Given the overall bullish trend, await a pullback to the 0.6070 support level. Enter the trade only after a bullish candle close confirms acceptance. Adjust your position size according to your risk parameters, and consider trailing your stop if momentum persists beyond 0.6090. Be prepared to exit if price rejects at resistance, indicating a potential shift.
Looking for powerful AI trading signals? Visit ProSignal.ai and take your trading to the next level! or join our telegram channel at t.me/prosignalai
Disclaimer
The information and publications are not meant to be, and do not constitute, financial, investment, trading, or other types of advice or recommendations supplied or endorsed by TradingView. Read more in the Terms of Use.