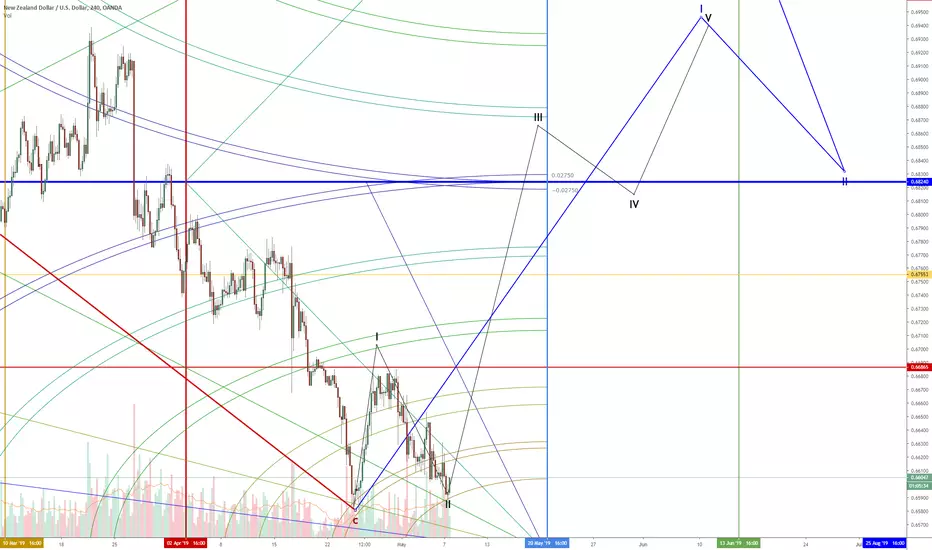
Gann's 'Death Zone' is a 49-day cycle (7 days x 7 weeks = 49 days). It's shocking how many times a 49-day cycle can reverse a market. So it is no coincidence that the speed that the NZDUSD pair has dropped and has come into a major confluence zone of change. The highest probability move here is one higher - small probability of a continuation move lower. The Optex Bands are in a definite oversold condition on the daily chart. The 4-hour chart shows that the NZDUSD is primed for a push higher with the RSI being in a support zone and the Composite Index sloping higher and about to cross above its averages. Extremely bullish here.
Note
Venus Conjunct Chiron (Geocentric) - a shared low with most recent major low on October 31st, 2000.Trade active
Breakout higher imminent Trade active
Added 2 lots at 0.6566Note
Added 2 more lots at 0.6502Trade active
Still active - prepping for bounce.Trade active
Took 4 lots profit at 0.67Trade active
Still holding and active - it's July 3rd, an important Gann date where moves culminate and trends terminate between July 3rd and July 7th.Trade active
Still holding, expecting a larger turn higher over the next two weeks. If not, I'll take the loss for tax purposes :-)Disclaimer
The information and publications are not meant to be, and do not constitute, financial, investment, trading, or other types of advice or recommendations supplied or endorsed by TradingView. Read more in the Terms of Use.
Disclaimer
The information and publications are not meant to be, and do not constitute, financial, investment, trading, or other types of advice or recommendations supplied or endorsed by TradingView. Read more in the Terms of Use.