📊 Chart Elements Breakdown
✅ Trade Setup
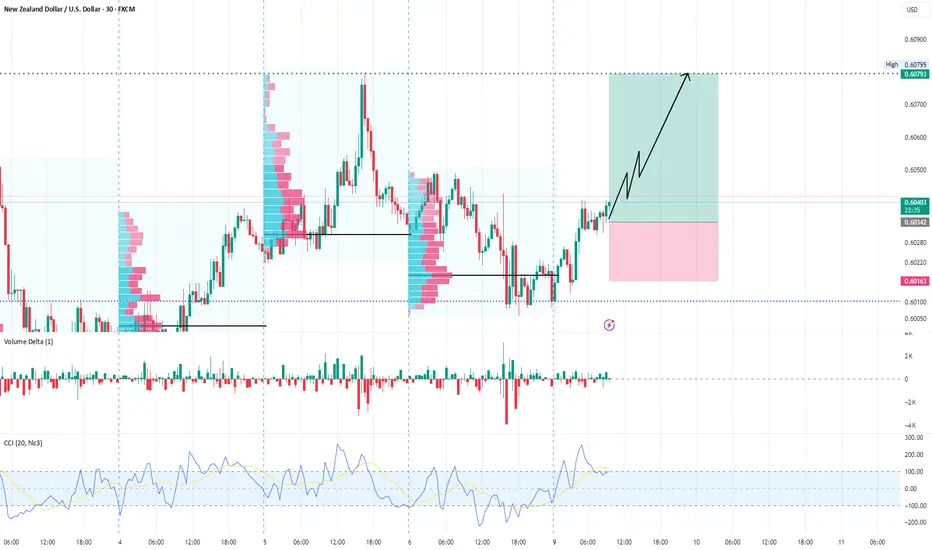
Buy Entry Zone: Around 0.60385
Stop Loss (Red Zone): Below 0.60163
Take Profit (Green Zone): Near 0.60795
Risk/Reward Ratio: Roughly 1:2, showing a favorable setup
📈 Indicators & Tools Used
1. Volume Profile (Visible Range)
Displays where the most trading activity (volume) occurred in each session.
You’ve marked high-volume nodes (HVN) and low-volume areas.
Price is moving away from a high-volume consolidation zone, suggesting a breakout attempt.
2. Volume Delta (Histogram)
Shows the difference between buying and selling volume.
Currently showing increasing green bars → bullish delta, indicating buyers are gaining control.
3. CCI (Commodity Channel Index)
CCI(20) is above +100, signaling overbought conditions but also confirming bullish momentum.
This supports the bullish move continuation theory.
🧠 Trading Logic
Accumulation Zone identified before the breakout (low-volume area marked).
Price retested support and showed strength with a bounce.
The break above recent structure around 0.6035 combined with positive delta and CCI signals is a bullish confluence.
Targeting the previous swing high at 0.60795 aligns with volume-based resistance.
🔍 Summary
You're anticipating:
A bullish continuation after a clean retest of support.
Strong buying pressure confirmed by Volume Delta and CCI.
A breakout from a range, potentially targeting liquidity above 0.6079.
✅ Trade Setup
Buy Entry Zone: Around 0.60385
Stop Loss (Red Zone): Below 0.60163
Take Profit (Green Zone): Near 0.60795
Risk/Reward Ratio: Roughly 1:2, showing a favorable setup
📈 Indicators & Tools Used
1. Volume Profile (Visible Range)
Displays where the most trading activity (volume) occurred in each session.
You’ve marked high-volume nodes (HVN) and low-volume areas.
Price is moving away from a high-volume consolidation zone, suggesting a breakout attempt.
2. Volume Delta (Histogram)
Shows the difference between buying and selling volume.
Currently showing increasing green bars → bullish delta, indicating buyers are gaining control.
3. CCI (Commodity Channel Index)
CCI(20) is above +100, signaling overbought conditions but also confirming bullish momentum.
This supports the bullish move continuation theory.
🧠 Trading Logic
Accumulation Zone identified before the breakout (low-volume area marked).
Price retested support and showed strength with a bounce.
The break above recent structure around 0.6035 combined with positive delta and CCI signals is a bullish confluence.
Targeting the previous swing high at 0.60795 aligns with volume-based resistance.
🔍 Summary
You're anticipating:
A bullish continuation after a clean retest of support.
Strong buying pressure confirmed by Volume Delta and CCI.
A breakout from a range, potentially targeting liquidity above 0.6079.
Disclaimer
The information and publications are not meant to be, and do not constitute, financial, investment, trading, or other types of advice or recommendations supplied or endorsed by TradingView. Read more in the Terms of Use.
Disclaimer
The information and publications are not meant to be, and do not constitute, financial, investment, trading, or other types of advice or recommendations supplied or endorsed by TradingView. Read more in the Terms of Use.