### 🔄 **Basic Structure of Point 1-2-3 Setup**:
1. **Point 1 (P1):** The initial move or swing low/high (starting point).
2. **Point 2 (P2):** The opposite extreme – the highest high (uptrend) or lowest low (downtrend).
3. **Point 3 (P3):** A correction that doesn’t exceed P1, followed by a potential breakout beyond P2 to confirm a new trend.
---
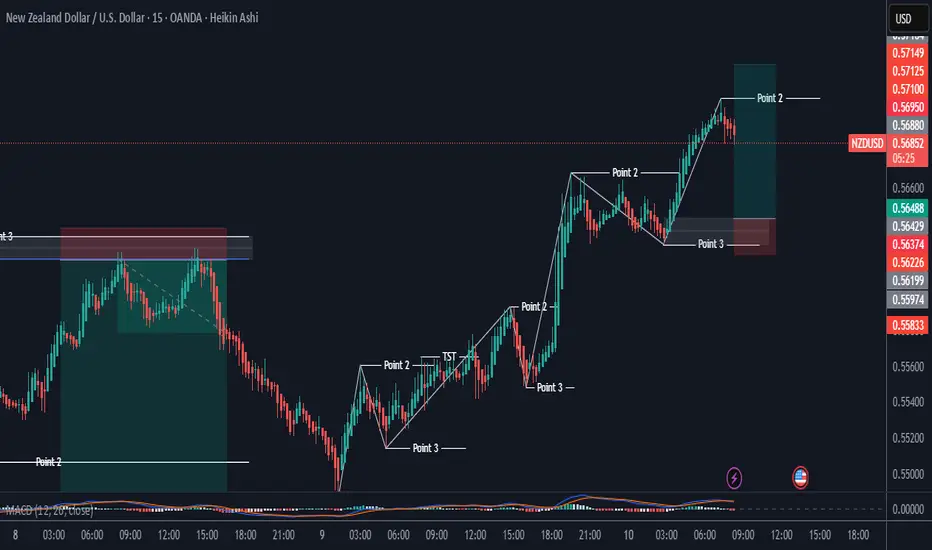
### ✅ **Chart Analysis (NZD/USD, Heikin Ashi, 15 Min)**:
#### 📉 **First Major Bearish Move** (Left side of the chart):
- **P1:** Price peaks (Point 2 is marked near 0.571xx).
- **P2:** Swing low around 0.563xx (Point 2 in white).
- **P3:** Retracement (fails to break the initial high, confirming potential trend change).
- Then the price **breaks below P2**, confirming a **new downtrend**.
This bearish structure played out with a **short position**, visualized by the red trade box.
---
#### 📈 **Reversal to Bullish Trend** (Middle to right side):
- After a long downtrend, a shift occurs.
- New **Point 1**: A swing low forms (around 0.558xx).
- **Point 2**: Price pushes up to a local high (confirmed with white lines).
- **Point 3**: Retracement that stays above Point 1 (0.558xx zone).
Then:
- **TST (Test)** occurs: Price revisits P3 zone but holds.
- Break above **Point 2** confirms **bullish trend**.
- We see **multiple fractal P1-2-3 formations** up the rally:
- Smaller structures form within the bigger bullish move (each followed by breakouts).
---
### 📌 **Most Recent Trade Setup (Far Right)**:
- **P1:** Swing low (end of pullback).
- **P2:** Local peak after a bullish impulse.
- **P3:** Pullback that doesn’t break P1.
- **Breakout above P2 confirms long position**, shown by the current green box trade setup.
This trade is still active, with the price hovering slightly above entry.
---
### 🧠 Summary (Das Voigt Logic Applied):
- The chart follows textbook **Point 1-2-3 trend development**, first bearish, then a clean shift to bullish.
- Multiple entries are possible using **sub-structures** within the main trend.
- The key is **waiting for P3 to hold** and then **confirmation via breakout of P2**.
Would you like me to mark up the chart with the Point 1, 2, 3 labels and send it back for clarity?
Disclaimer
The information and publications are not meant to be, and do not constitute, financial, investment, trading, or other types of advice or recommendations supplied or endorsed by TradingView. Read more in the Terms of Use.
Disclaimer
The information and publications are not meant to be, and do not constitute, financial, investment, trading, or other types of advice or recommendations supplied or endorsed by TradingView. Read more in the Terms of Use.