NZDUSD - 3D Chart Elliott Wave Outlook
We've been tracking NZDUSD over the years and each move continues to align with Elliott Wave Theory.
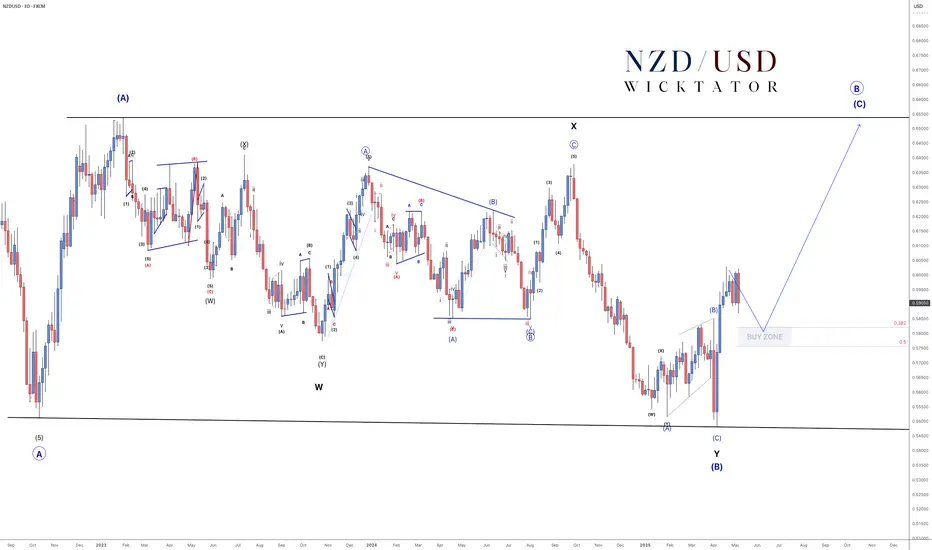
The current structure is unfolding as a large ABC corrective pattern.
- Wave A and the complex Wave B (WXY) are now complete.
- We're now in Wave C, and we expect it to target the highs of Wave A.
Recently, NZDUSD made a clear bullish impulse but has been consolidating for the past 3 weeks. This correction is likely to resolve with a bullish breakout.
We've marked a buy zone between the 38.2% and 50% Fibonacci retracement levels, which we believe is the ideal entry area. We'll be watching this zone closely for lower timeframe bullish confirmations like a break of structure (BOS) or trendline break.
Trade Plan:
- Wait for price to enter the buy zone
- Look for bullish confirmations (BOS, trendline break)
- Enter after confirmation, with stops below the corrective lows
- Targets: 0.63 (500 pips), 0.65 (700 pips)
Goodluck and as always, Trade Safe!
We've been tracking NZDUSD over the years and each move continues to align with Elliott Wave Theory.
The current structure is unfolding as a large ABC corrective pattern.
- Wave A and the complex Wave B (WXY) are now complete.
- We're now in Wave C, and we expect it to target the highs of Wave A.
Recently, NZDUSD made a clear bullish impulse but has been consolidating for the past 3 weeks. This correction is likely to resolve with a bullish breakout.
We've marked a buy zone between the 38.2% and 50% Fibonacci retracement levels, which we believe is the ideal entry area. We'll be watching this zone closely for lower timeframe bullish confirmations like a break of structure (BOS) or trendline break.
Trade Plan:
- Wait for price to enter the buy zone
- Look for bullish confirmations (BOS, trendline break)
- Enter after confirmation, with stops below the corrective lows
- Targets: 0.63 (500 pips), 0.65 (700 pips)
Goodluck and as always, Trade Safe!
Want more chart ups like this? Click the links below:
Free Telegram: t.me/Wicktator
Forex VIP: t.me/WicktatatorVIP_bot
Free Telegram: t.me/Wicktator
Forex VIP: t.me/WicktatatorVIP_bot
Disclaimer
The information and publications are not meant to be, and do not constitute, financial, investment, trading, or other types of advice or recommendations supplied or endorsed by TradingView. Read more in the Terms of Use.