Hello,
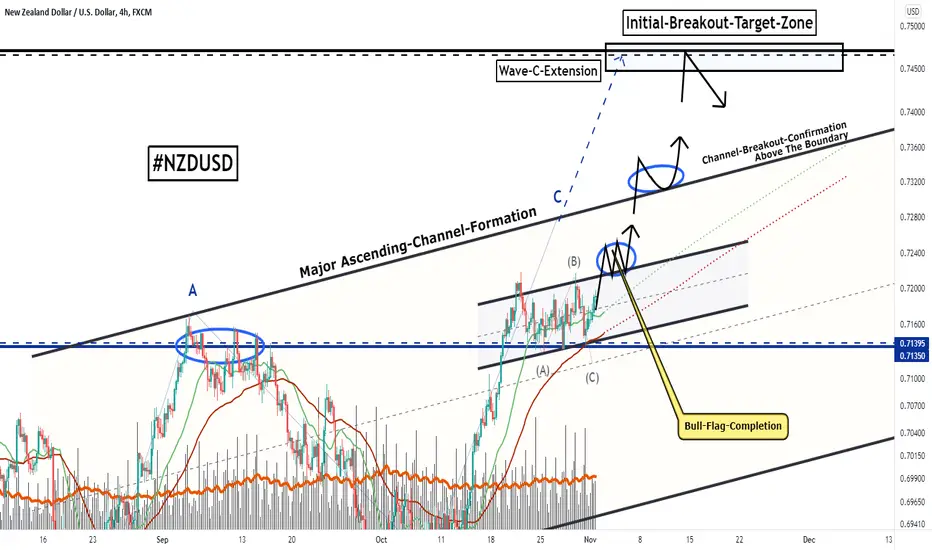
Welcome to this analysis about NZDUSD and the 4-hour timeframe perspectives. In recent times NZDUSD managed to increase further and make new highs in the structure especially bouncing above important resistance zones which are now support. Therefore, as I discovered now when looking at my chart we can watch there how NZDUSD made the breakout above the 55-EMA in red and the 20-EMA in green. Together with these EMAs NZDUSD has also appropriate support within the 0.7135 Usd level marked in blue with which NZDUSD is building the main support cluster where it is building now upon. Above this suggested support cluster NZDUSD is building the bull-flag-formation now, this formation completes with a breakout above the upper-boundary of the bull-flag and once this is done NZDUSD is likely to move on forward to finally complete this whole ascending-channel-formation with a breakout above the upper-boundary like it is marked in my chart, such a breakout will lead to the wave-C-extension and NZDUSD will approach the upper-target-zone within the 0.745 level marked in my chart in black.
In this manner, thank you for watching the analysis, it will be great when you support it with a like, follow and comment for more upcoming market analysis, all the best!
"Good luck is when opportunity meets preparation."
Information provided is only educational and should not be used to take action in the markets.
►✅JOIN THE BEST+ TOP TELEGRAM TRADING CHANNEL: t.me/VincePrinceForexGoldStocks
►🚀Write To Join the Elite VIP Signal Channels: @Vince_Prince
►🔥JOIN BYBIT TOP EXCHANGE►🎁 UP TO $30,000 BONUS NOW: partner.bybit.com/b/VinceByBit
►🚀Write To Join the Elite VIP Signal Channels: @Vince_Prince
►🔥JOIN BYBIT TOP EXCHANGE►🎁 UP TO $30,000 BONUS NOW: partner.bybit.com/b/VinceByBit
Disclaimer
The information and publications are not meant to be, and do not constitute, financial, investment, trading, or other types of advice or recommendations supplied or endorsed by TradingView. Read more in the Terms of Use.