The U.S. dollar continued its downward trend yesterday, influenced by dovish remarks from Federal Reserve's Kashkari, who aligned with other policymakers in suggesting a potential rate cut as early as September. This shift in tone was largely prompted by the softer-than-expected Non-Farm Payroll (NFP) report released last Friday.
While the employment data wasn’t as dire as initial market reactions suggested, it did cause some reevaluation. Prior to the report, market positioning was geared toward a robust labor market, and the Fed’s hawkish stance had already been priced in. The unexpectedly weak data, therefore, prompted a swift adjustment in expectations, leading to a rapid reprice of the dollar.
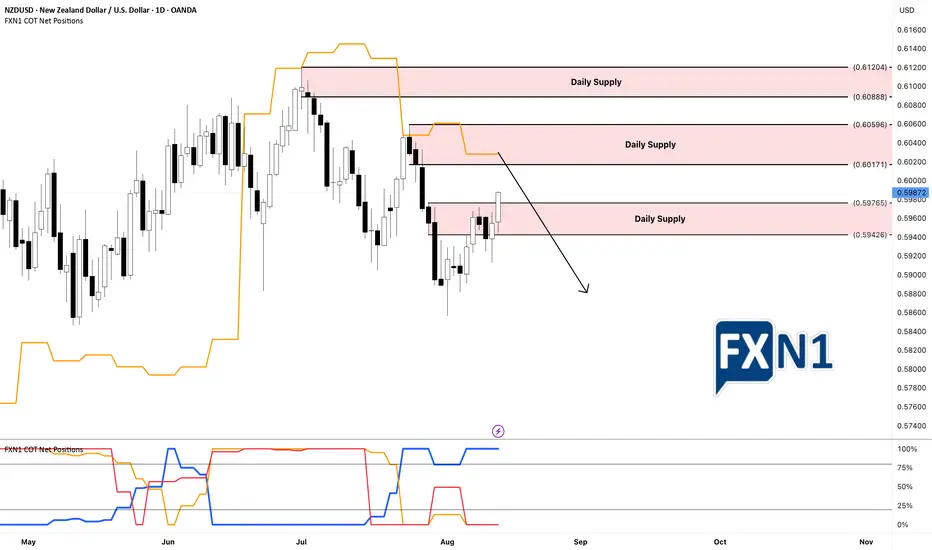
On the technical front, the NZD/USD chart highlights the breach of our previous daily supply zone following the release of the CPI data. However, I’ve decided to place a limit order at the next supply level. From a fundamental perspective, the recent activity of non-commercial traders adding short positions last week indicates a potential divergence between the chart pattern and underlying fundamentals. This divergence suggests opportunities for strategic entries as market sentiment and macroeconomic signals appear to be at odds.
✅ Please share your thoughts about NZDUSD in the comments section below and HIT LIKE if you appreciate my analysis. Don't forget to FOLLOW ME; you will help us a lot with this small contribution.
While the employment data wasn’t as dire as initial market reactions suggested, it did cause some reevaluation. Prior to the report, market positioning was geared toward a robust labor market, and the Fed’s hawkish stance had already been priced in. The unexpectedly weak data, therefore, prompted a swift adjustment in expectations, leading to a rapid reprice of the dollar.
On the technical front, the NZD/USD chart highlights the breach of our previous daily supply zone following the release of the CPI data. However, I’ve decided to place a limit order at the next supply level. From a fundamental perspective, the recent activity of non-commercial traders adding short positions last week indicates a potential divergence between the chart pattern and underlying fundamentals. This divergence suggests opportunities for strategic entries as market sentiment and macroeconomic signals appear to be at odds.
✅ Please share your thoughts about NZDUSD in the comments section below and HIT LIKE if you appreciate my analysis. Don't forget to FOLLOW ME; you will help us a lot with this small contribution.
✅ TELEGRAM CHANNEL: t.me/+VECQWxY0YXKRXLod
🔥 USA ZERO SPREAD BROKER: forexn1.com/usa/
🔥 UP to 4000$ BONUS: forexn1.com/broker/
🟪 Instagram: instagram.com/forexn1_com/
🔥 USA ZERO SPREAD BROKER: forexn1.com/usa/
🔥 UP to 4000$ BONUS: forexn1.com/broker/
🟪 Instagram: instagram.com/forexn1_com/
Disclaimer
The information and publications are not meant to be, and do not constitute, financial, investment, trading, or other types of advice or recommendations supplied or endorsed by TradingView. Read more in the Terms of Use.