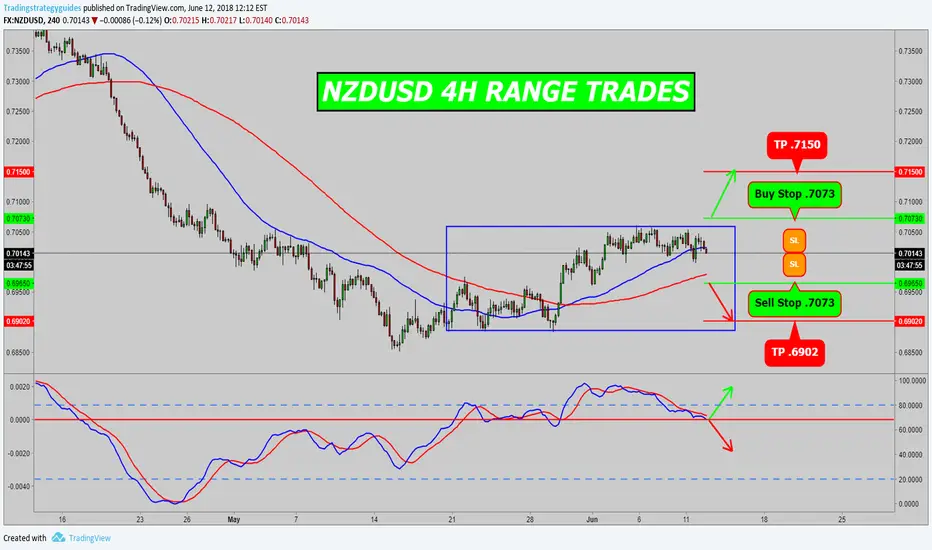
NZDUSD is in an bullish uptrend.
It has moved sideways in a range
Watch Macd for direction
Bullish Range Breakout Trade
Buy Stop .7073
Take Profit .7150
SL below Range top
Bearish Range Trade
Enter below 100 sma
Sell Stop .6965
Take Profit .6902
SL above 100 sma
It has moved sideways in a range
Watch Macd for direction
Bullish Range Breakout Trade
Buy Stop .7073
Take Profit .7150
SL below Range top
Bearish Range Trade
Enter below 100 sma
Sell Stop .6965
Take Profit .6902
SL above 100 sma
Note
Red line on the chart is a 100 sma (simple moving average)Blue line on the chart is a 50 sma (simple moving average)
Note
Price will usually cross below the 50 sma and then go halfway and return to 50 sma then if market timing is right it will fall below the 50 sma again and go to the 100 sma. It has done all that but has paused at the halfway mark. We will see if price continues to the 100 sma or stays there or back to the 50 sma until the FOMC is done tomorrow. Note
Sell Stop .6902Note
Lets try again Sell Stop .6965Price broke below 100 sma heading to bottom of range
Disclaimer
The information and publications are not meant to be, and do not constitute, financial, investment, trading, or other types of advice or recommendations supplied or endorsed by TradingView. Read more in the Terms of Use.
Disclaimer
The information and publications are not meant to be, and do not constitute, financial, investment, trading, or other types of advice or recommendations supplied or endorsed by TradingView. Read more in the Terms of Use.