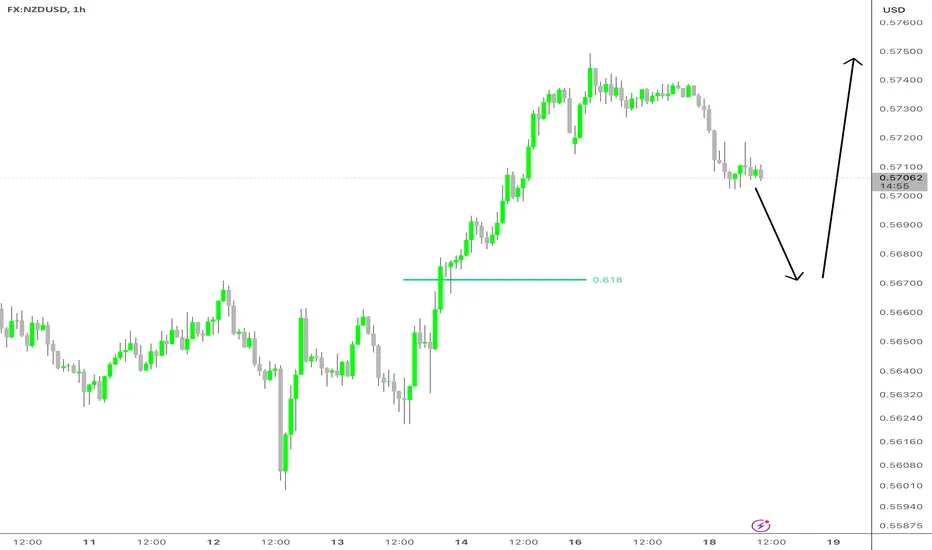
I believe the price will first decline to the marked level before reversing and moving back up. I have drawn a Fibonacci retracement, specifically highlighting the 0.618 level, which is often considered a strong support zone in technical analysis. If the price reaches this level, it may find buying pressure, leading to a potential bullish move. The arrows on the chart illustrate this possible scenario, where the price initially drops and then rebounds upward. However, if the support fails, a deeper decline could occur before any potential recovery.
Disclaimer
The information and publications are not meant to be, and do not constitute, financial, investment, trading, or other types of advice or recommendations supplied or endorsed by TradingView. Read more in the Terms of Use.
Disclaimer
The information and publications are not meant to be, and do not constitute, financial, investment, trading, or other types of advice or recommendations supplied or endorsed by TradingView. Read more in the Terms of Use.