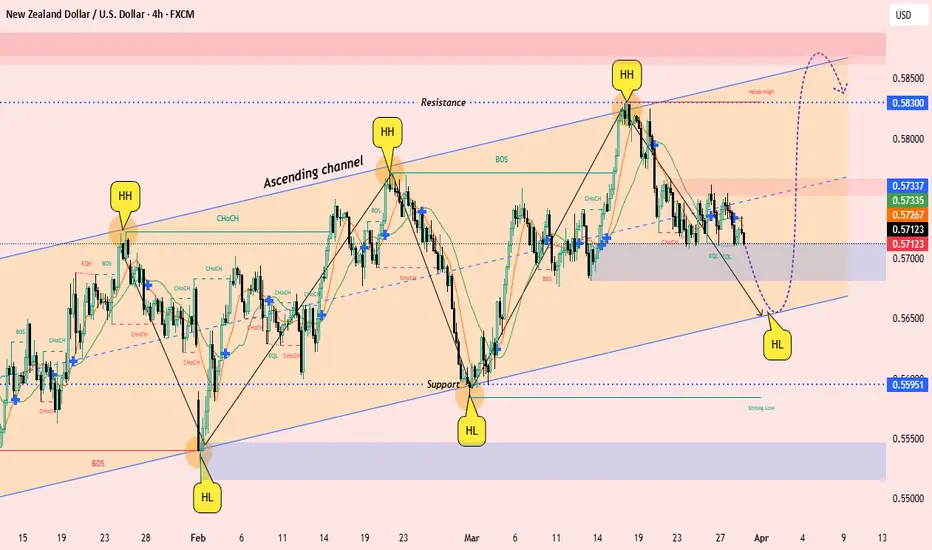
### *Analysis of the NZD/USD (4-Hour) Chart*
This chart focuses on market structure, trend analysis, and potential price action scenarios using *technical analysis tools*.
---
### *Key Patterns & Tools Used:*
#### *1. Market Structure Concepts:*
- *CHoCH (Change of Character):*
- Indicates shifts in market sentiment.
- *BOS (Break of Structure):*
- Confirms market trend direction after price breaks previous highs or lows.
#### *2. Price Action Patterns:*
- *Ascending Channel (Blue Trendlines):*
- Price moves within an upward sloping channel, forming *higher highs (HH) and higher lows (HL)*.
- *Support & Resistance Zones:*
- *Resistance (Red Zone):* Identifies the upper boundary where price might struggle.
- *Support (Blue Zone):* Indicates a demand area where price could bounce.
#### *3. Trade Setup & Projection:*
- *Bullish Scenario:*
- If price respects the support zone and forms another *higher low (HL)*, it could continue upward toward resistance.
- *Bearish Scenario:*
- A breakdown below the ascending channel might invalidate the bullish bias, leading to a lower price move.
---
### *Conclusion & Trading Implications:*
- *Probable Long Setup:*
- Waiting for a bounce at the lower channel support and confirmation of an uptrend.
- *Risk Management:*
- A break below the *support zone* would signal further downside.
Would you like specific trade entries and stop-loss levels based on this analysis?
Disclaimer
The information and publications are not meant to be, and do not constitute, financial, investment, trading, or other types of advice or recommendations supplied or endorsed by TradingView. Read more in the Terms of Use.
Disclaimer
The information and publications are not meant to be, and do not constitute, financial, investment, trading, or other types of advice or recommendations supplied or endorsed by TradingView. Read more in the Terms of Use.