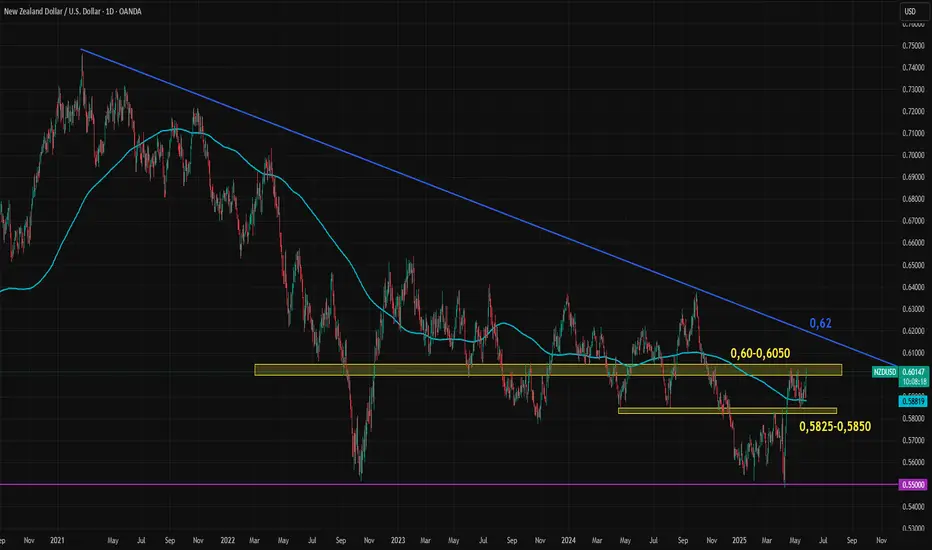
NZDUSD has been forming a descending triangle pattern since 2020. After the wide swings triggered by the COVID-19 shock, price action has gradually contracted. The downside has been limited near 0.55, while the topside has followed a clear descending trendline, currently sitting around 0.62.
Following a brief surge in April, NZDUSD has entered a short-term flat trend, with two key support and resistance zones capping volatility, potentially the calm before the storm. The 0.5825–0.5850 zone acts as support, while 0.60–0.6050 serves as resistance.
This week, major events including the RBNZ decision, FOMC minutes, U.S. consumer sentiment, PCE, and GDP data could break this low-volatility pattern. A decisive move toward either the upper or lower boundary of the descending triangle may be imminent.
Disclaimer
The information and publications are not meant to be, and do not constitute, financial, investment, trading, or other types of advice or recommendations supplied or endorsed by TradingView. Read more in the Terms of Use.
Disclaimer
The information and publications are not meant to be, and do not constitute, financial, investment, trading, or other types of advice or recommendations supplied or endorsed by TradingView. Read more in the Terms of Use.