**Analyzing Ocean Protocol (OCEAN/USD): The Power of Support, Resistance, and the 21 EMA**
When trading or investing in the ever-changing world of cryptocurrencies, technical analysis tools offer vital insights into price action and market psychology. Let’s explore how these concepts play out in the recent price chart of Ocean Protocol (OCEAN/USD).
**Dynamic and Static Support/Resistance: A Quick Primer**
Support and resistance are foundational concepts in technical analysis:
- **Support** refers to price zones where a declining market tends to find a “floor,” often pausing or reversing losses.
- **Resistance** marks zones where rising prices tend to stall or reverse, acting as a “ceiling.”
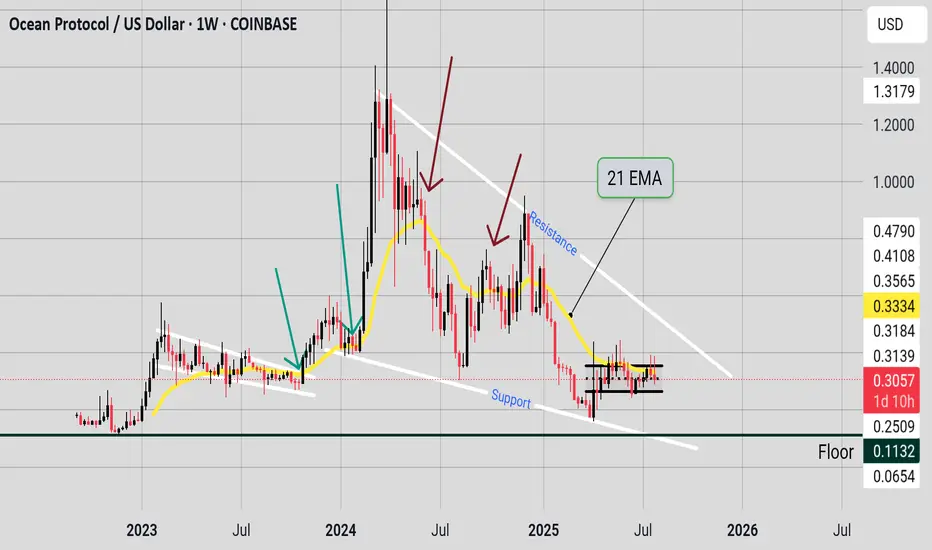
On the OCEAN/USD weekly chart, I marked these static levels at price points where the market has historically reacted, reflecting the areas of repeated reversals or consolidation. Identifying these levels allows traders to anticipate potential moves and manage risk.
**The 21 Exponential Moving Average (EMA): A Dynamic Barrier**
A standout element on our chart is the 21-period EMA, plotted as a gently curving yellow line. Unlike static horizontal lines, the 21 EMA moves with price action, providing a dynamic measure of the prevailing trend. My analysis confirms that:
- In uptrends, the 21 EMA often acts as a support, helping price bounce higher during pullbacks.
- In downtrends, it acts as resistance, causing rallies to stall or reverse.
Repeated interactions between OCEAN’s price and the 21 EMA further validate its role as a crucial area to watch, where buyers and sellers contend for control.
**Descending Resistance and Support: Guiding the Trend**
I’ve also drawn descending (diagonally sloping) trendlines to highlight the broader bearish structure since mid-2024. These lines mark a channel where price has generally been contained, further defining the primary market trend and its boundaries.
**Conclusion: Clarity from Structure**
Through the combination of classic support and resistance lines and the dynamic 21 EMA—which both reliably reflect real market turning points—this analysis brings clarity to OCEAN’s current market structure. These tools not only offer traders a roadmap for likely reactions but also foster a disciplined approach to navigating crypto’s volatility.
*By combining proven tools like horizontal and diagonal support/resistance with the dynamic insight that moving averages provide, traders can approach complex charts like OCEAN/USD with greater confidence and objectivity.*
Please keep an eye for a breakout above the 21 EMA 0.33 price area for possible bullish action. Be cautious of fakeouts and liquidations.
(Some help with the AI Perplexity)
When trading or investing in the ever-changing world of cryptocurrencies, technical analysis tools offer vital insights into price action and market psychology. Let’s explore how these concepts play out in the recent price chart of Ocean Protocol (OCEAN/USD).
**Dynamic and Static Support/Resistance: A Quick Primer**
Support and resistance are foundational concepts in technical analysis:
- **Support** refers to price zones where a declining market tends to find a “floor,” often pausing or reversing losses.
- **Resistance** marks zones where rising prices tend to stall or reverse, acting as a “ceiling.”
On the OCEAN/USD weekly chart, I marked these static levels at price points where the market has historically reacted, reflecting the areas of repeated reversals or consolidation. Identifying these levels allows traders to anticipate potential moves and manage risk.
**The 21 Exponential Moving Average (EMA): A Dynamic Barrier**
A standout element on our chart is the 21-period EMA, plotted as a gently curving yellow line. Unlike static horizontal lines, the 21 EMA moves with price action, providing a dynamic measure of the prevailing trend. My analysis confirms that:
- In uptrends, the 21 EMA often acts as a support, helping price bounce higher during pullbacks.
- In downtrends, it acts as resistance, causing rallies to stall or reverse.
Repeated interactions between OCEAN’s price and the 21 EMA further validate its role as a crucial area to watch, where buyers and sellers contend for control.
**Descending Resistance and Support: Guiding the Trend**
I’ve also drawn descending (diagonally sloping) trendlines to highlight the broader bearish structure since mid-2024. These lines mark a channel where price has generally been contained, further defining the primary market trend and its boundaries.
**Conclusion: Clarity from Structure**
Through the combination of classic support and resistance lines and the dynamic 21 EMA—which both reliably reflect real market turning points—this analysis brings clarity to OCEAN’s current market structure. These tools not only offer traders a roadmap for likely reactions but also foster a disciplined approach to navigating crypto’s volatility.
*By combining proven tools like horizontal and diagonal support/resistance with the dynamic insight that moving averages provide, traders can approach complex charts like OCEAN/USD with greater confidence and objectivity.*
Please keep an eye for a breakout above the 21 EMA 0.33 price area for possible bullish action. Be cautious of fakeouts and liquidations.
(Some help with the AI Perplexity)
Disclaimer
The information and publications are not meant to be, and do not constitute, financial, investment, trading, or other types of advice or recommendations supplied or endorsed by TradingView. Read more in the Terms of Use.
Disclaimer
The information and publications are not meant to be, and do not constitute, financial, investment, trading, or other types of advice or recommendations supplied or endorsed by TradingView. Read more in the Terms of Use.