Trading Opportunities with Clear Support and Resistance Zones
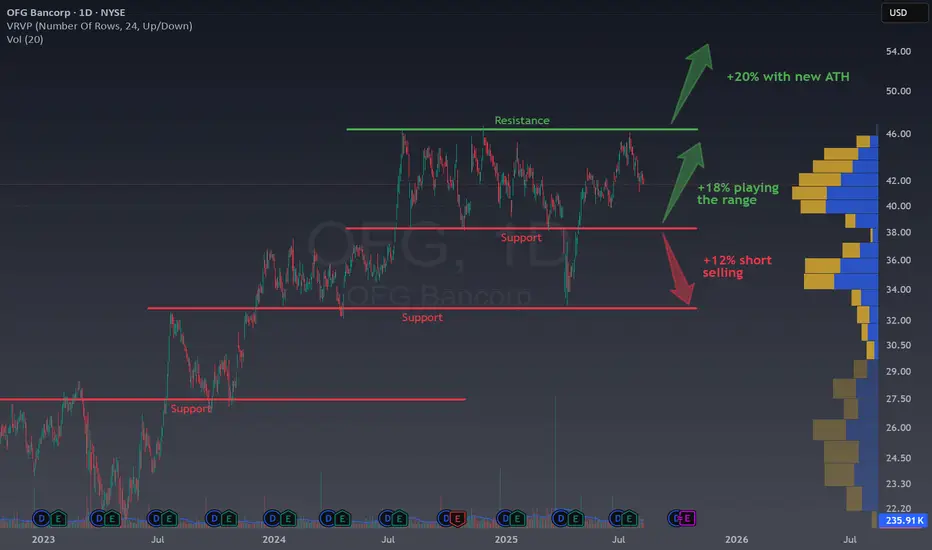
The daily chart of OFG Bancorp OFG is a textbook example of how well-defined support and resistance levels can present multiple high-probability trading opportunities. These technical zones are easily recognizable and offer traders and investors strong setups for both long and short positions with attractive risk/reward profiles.
Technical Analysis: Clear Zones = Strong Opportunities
Support and Resistance
The chart highlights key resistance levels around $38 and $32, with a solid support frame near $46.
Range Trading
Buying near support or selling near resistance has consistently provided rebounds or pullbacks, generating solid short-term returns.
Breakout Trades
Entering trades on the breakout above resistance (or below support) allows for catching big moves, especially when the price establishes a new all-time high (ATH) or breaks down from established ranges.
Current opportunities:
1. Buy in the breakout of the green resistance, by risking around 4% you should easily earn 20% if the break is not fake.
2. Buy when the price reach the first support, buy at $38-39, use a tight SL of 4% to earn up to 18% if the price goes again to the ATHs.
3. In case OFG starts losing some steam due to, for example, lower interest rates, we could sell under $38 to see the price fall a fast 12% like this April.
Risk/Reward
Limited Risk: Entry signals are generated as close as possible to support or resistance zones, typically risking only 3–4% on each trade.
Substantial Gains: Historical setups have shown that profits of 12% (short side) up to 20% (long side, with new ATHs) are entirely realistic, making the risk/reward ratio extremely favorable. And this is the keystone for any strategy.
The chart’s visual simplicity means that even those newer to price action trading can spot and plan trades effectively, it’s all about being patient and attentive to price at these key levels.
A Quick Fundamental Context
OFG Bancorp is a financial holding company based in Puerto Rico. It provides various banking and financial services to consumers, businesses, and institutions. The company has shown solid performance in maintaining profitability and managing risks, even amid changes in the economic environment. Steady earnings, prudent loan management, and a clear market niche have helped OFG sustain investor confidence and support its technical strength on the chart.
For traders, this backdrop adds another layer: a stable fundamental story enhances the reliability of trading the technical patterns visible in the stock.
Some previous ideas on supports and resitances:
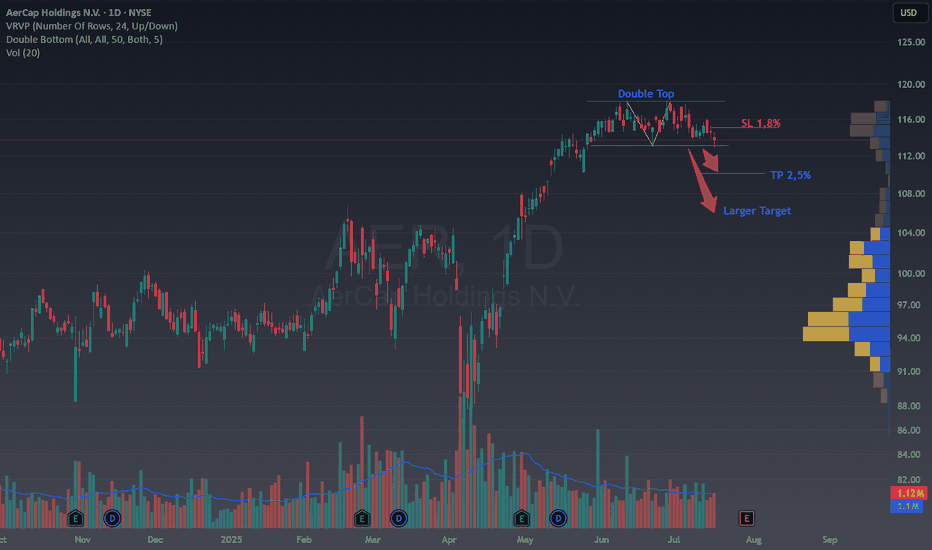
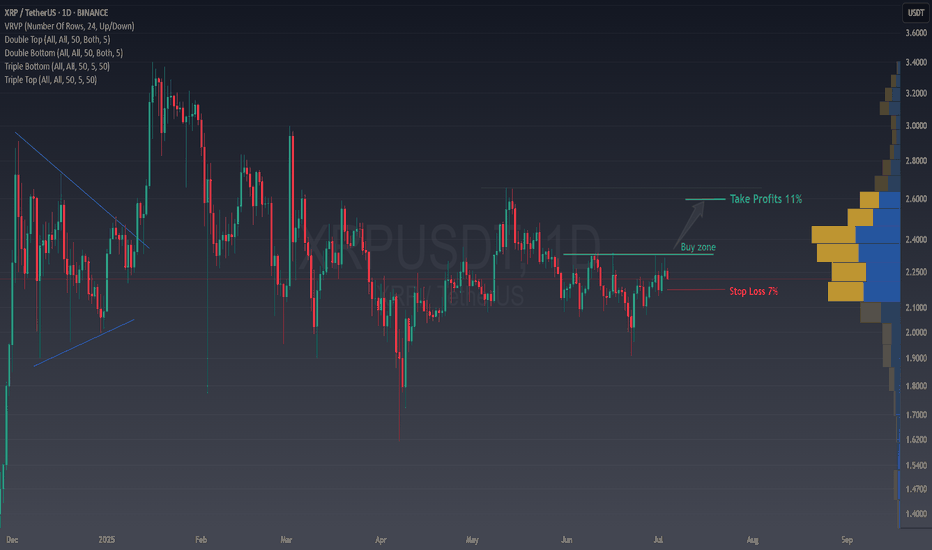
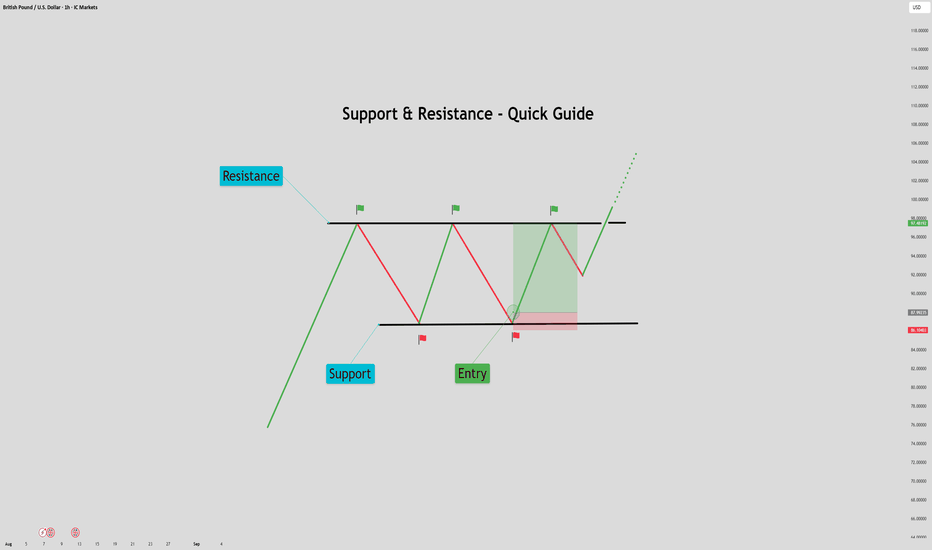
If you want to know more about supports and resistances Tradingview posted recently in the Home page an educational video of a TV user which is quite interesting to understand supports and resitances.
💬 Does this setup align with your view onOFG ?
🚀 Hit the rocket if this helped you spot the opportunity and follow for more easy, educational trade ideas!
The daily chart of OFG Bancorp
Technical Analysis: Clear Zones = Strong Opportunities
Support and Resistance
The chart highlights key resistance levels around $38 and $32, with a solid support frame near $46.
Range Trading
Buying near support or selling near resistance has consistently provided rebounds or pullbacks, generating solid short-term returns.
Breakout Trades
Entering trades on the breakout above resistance (or below support) allows for catching big moves, especially when the price establishes a new all-time high (ATH) or breaks down from established ranges.
Current opportunities:
1. Buy in the breakout of the green resistance, by risking around 4% you should easily earn 20% if the break is not fake.
2. Buy when the price reach the first support, buy at $38-39, use a tight SL of 4% to earn up to 18% if the price goes again to the ATHs.
3. In case OFG starts losing some steam due to, for example, lower interest rates, we could sell under $38 to see the price fall a fast 12% like this April.
Risk/Reward
Limited Risk: Entry signals are generated as close as possible to support or resistance zones, typically risking only 3–4% on each trade.
Substantial Gains: Historical setups have shown that profits of 12% (short side) up to 20% (long side, with new ATHs) are entirely realistic, making the risk/reward ratio extremely favorable. And this is the keystone for any strategy.
The chart’s visual simplicity means that even those newer to price action trading can spot and plan trades effectively, it’s all about being patient and attentive to price at these key levels.
A Quick Fundamental Context
OFG Bancorp is a financial holding company based in Puerto Rico. It provides various banking and financial services to consumers, businesses, and institutions. The company has shown solid performance in maintaining profitability and managing risks, even amid changes in the economic environment. Steady earnings, prudent loan management, and a clear market niche have helped OFG sustain investor confidence and support its technical strength on the chart.
For traders, this backdrop adds another layer: a stable fundamental story enhances the reliability of trading the technical patterns visible in the stock.
Some previous ideas on supports and resitances:
If you want to know more about supports and resistances Tradingview posted recently in the Home page an educational video of a TV user which is quite interesting to understand supports and resitances.
💬 Does this setup align with your view on
🚀 Hit the rocket if this helped you spot the opportunity and follow for more easy, educational trade ideas!
Related publications
Disclaimer
The information and publications are not meant to be, and do not constitute, financial, investment, trading, or other types of advice or recommendations supplied or endorsed by TradingView. Read more in the Terms of Use.
Related publications
Disclaimer
The information and publications are not meant to be, and do not constitute, financial, investment, trading, or other types of advice or recommendations supplied or endorsed by TradingView. Read more in the Terms of Use.