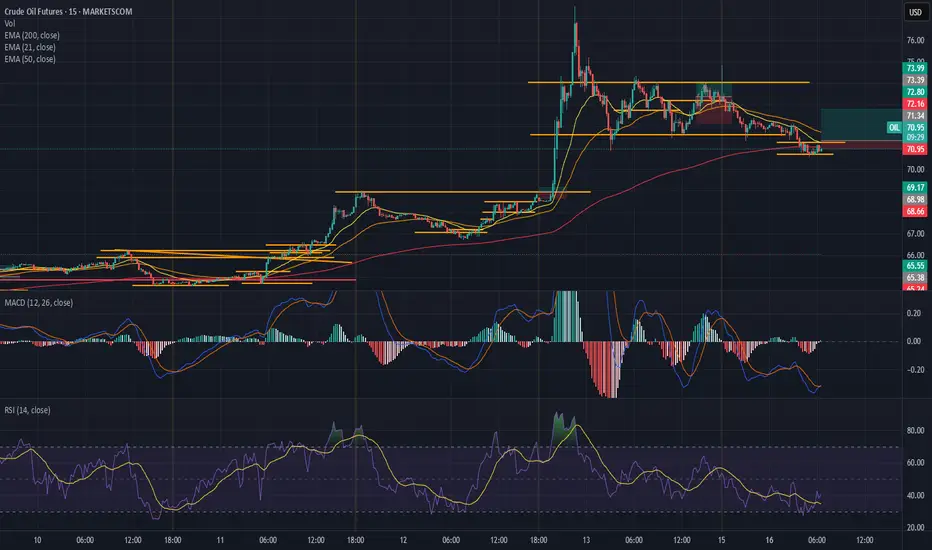
CRUDE OIL FUTURES – 15-Min Chart Analysis (June 16, 2025 – 06:23 UTC-4)
Ticker: OIL (MARKETSCOM)
Current Price: ~$70.97
Trend: Short-term bearish correction after major rally
EMA Signals: Bearish pressure building below 21 EMA, 50 EMA, and at 200 EMA support
🔍 Technical Indicator Summary:
1. Moving Averages
EMA 21 = $72.97
EMA 50 = $72.88
EMA 200 = $70.72 (currently holding as dynamic support)
➡️ Price is squeezed just above the 200 EMA while remaining under key short-term EMAs, signaling temporary bearish control but near potential bounce zone.
2. MACD (12,26,9)
Histogram: Weak bearish momentum (slightly below 0)
Signal line below MACD line but flattening
➡️ Signs of bearish momentum exhaustion. Neutral to slight bullish lean if crossover happens.
3. RSI (14)
RSI = 40.65
Signal line = 49.76
➡️ Approaching oversold territory but not deeply enough to be a reversal signal alone. RSI flattening, suggesting possible price compression before decision.
🔒 Key Price Levels
🔻 Support Zones:
$70.70 (EMA 200) — crucial dynamic support
$70.00 – key horizontal and psychological support
$69.17 / $68.98 – deeper structure supports if $70 fails
🔺 Resistance Zones:
$72.15 (near-term resistance)
$73.39 – local structural peak
$73.99 – key double top zone
🎯 Trade Setup (Next 24 Hours)
✅ Scenario 1: Bounce from EMA 200 (Bullish Reversal)
Conditions for entry:
RSI climbs above 45 and MACD bullish crossover confirmed
Price holds $70.70 and reclaims $71.50+ on healthy volume
Entry:
📈 Buy breakout above $71.50 (confirmation above local lower high)
🎯 TP1: $72.20
🎯 TP2: $73.30
🛑 SL: $70.40 (below 200 EMA and recent low)
❌ Scenario 2: Breakdown Below $70.70 (Bearish Continuation)
Conditions:
MACD histogram expands red again
RSI drops under 38
Price closes below $70.70 with increasing volume
Entry:
📉 Short below $70.60
🎯 TP1: $70.00
🎯 TP2: $69.20
🛑 SL: $71.30 (above minor consolidation)
📊 Probability Forecast (Next 24h):
Scenario Probability Rationale
✅ Bullish Reversal 60% - EMA 200 historically strong bounce zone
MACD flattening
Price holding horizontal + dynamic support |
| ❌ Bearish Continuation | 40% | - Price below all short-term EMAs
Macro structure still shows lower highs
Breakdown below 200 EMA could trigger quick selloff to $70 / $69.2 |
🧠 Strategic Insight:
Buyers are defending EMA 200; short-term bears running out of steam.
Wait for RSI & MACD confirmation — price may range 1–3 more candles.
Low-risk long possible if we see price reclaim $71.50 with volume.
Note
Obviously. ChatGPT not good at analysis.Disclaimer
The information and publications are not meant to be, and do not constitute, financial, investment, trading, or other types of advice or recommendations supplied or endorsed by TradingView. Read more in the Terms of Use.
Disclaimer
The information and publications are not meant to be, and do not constitute, financial, investment, trading, or other types of advice or recommendations supplied or endorsed by TradingView. Read more in the Terms of Use.