Last week’s surge in crude oil following the escalating conflict in the Middle East sparked a wave of momentum buying as traders responded to the rising risk premium. But with prices now testing a key technical barrier, let’s take a look at whether this rally has legs or if it’s already starting to fade.
Escalation Risk Remains, but Has the Market Overreacted?
The threat of a wider conflict in the Middle East has brought renewed focus on Iran and the Strait of Hormuz. Roughly 20% of the world’s oil flows through that narrow waterway, and fears it could be disrupted are never far from traders’ minds. While there’s no shortage of tension, and risks remain elevated, actual supply has not yet been affected in any material way. Tankers continue to move through the region, albeit more cautiously, and there are signs of behind-the-scenes pressure to prevent further escalation.
In that context, the initial spike may have been more about emotion than fundamentals. Markets are forward-looking, but they can also overreact. Unless there is a clear supply shock or direct disruption to infrastructure, the recent jump could start to lose steam as attention shifts back to broader economic factors. For now, it feels like much of the premium is already priced in.
Technicals: Rally Meets Resistance
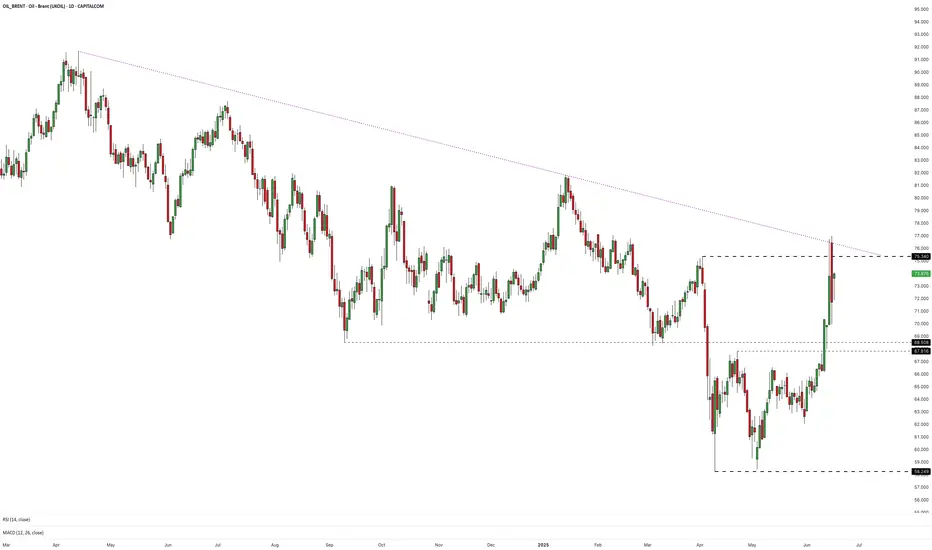
The breakout last week saw crude oil push beyond a prolonged consolidation phase, catching the attention of short-term traders. However, strong trends take time to reverse, and the rally has now run into the descending trendline that maps the swing highs from April and January. That trendline held firm on the first test, and momentum has started to waver.
Yesterday’s session opened with a gap higher but couldn’t push above Friday’s high. Instead, prices pressed briefly into the trendline before reversing and closing lower on the day — a sign of short-term exhaustion. On the hourly chart, we’ve now got the early shape of a double-top pattern forming, which often suggests a loss of bullish conviction at resistance.
Given the elevated macro risk, volatility is likely to remain high. Traders looking to participate here should consider using the Average True Range to size their stops more effectively. With the rally showing signs of fading and resistance still intact, near-term price action looks vulnerable to further cooling unless the trendline is taken out decisively.
Brent Crude (UKOIL) Daily Candle Chart

Past performance is not a reliable indicator of future results
Brent Crude (UKOIL) Hourly Candle Chart

Past performance is not a reliable indicator of future results
Disclaimer: This is for information and learning purposes only. The information provided does not constitute investment advice nor take into account the individual financial circumstances or objectives of any investor. Any information that may be provided relating to past performance is not a reliable indicator of future results or performance. Social media channels are not relevant for UK residents.
Spread bets and CFDs are complex instruments and come with a high risk of losing money rapidly due to leverage. 85.24% of retail investor accounts lose money when trading spread bets and CFDs with this provider. You should consider whether you understand how spread bets and CFDs work and whether you can afford to take the high risk of losing your money.
Escalation Risk Remains, but Has the Market Overreacted?
The threat of a wider conflict in the Middle East has brought renewed focus on Iran and the Strait of Hormuz. Roughly 20% of the world’s oil flows through that narrow waterway, and fears it could be disrupted are never far from traders’ minds. While there’s no shortage of tension, and risks remain elevated, actual supply has not yet been affected in any material way. Tankers continue to move through the region, albeit more cautiously, and there are signs of behind-the-scenes pressure to prevent further escalation.
In that context, the initial spike may have been more about emotion than fundamentals. Markets are forward-looking, but they can also overreact. Unless there is a clear supply shock or direct disruption to infrastructure, the recent jump could start to lose steam as attention shifts back to broader economic factors. For now, it feels like much of the premium is already priced in.
Technicals: Rally Meets Resistance
The breakout last week saw crude oil push beyond a prolonged consolidation phase, catching the attention of short-term traders. However, strong trends take time to reverse, and the rally has now run into the descending trendline that maps the swing highs from April and January. That trendline held firm on the first test, and momentum has started to waver.
Yesterday’s session opened with a gap higher but couldn’t push above Friday’s high. Instead, prices pressed briefly into the trendline before reversing and closing lower on the day — a sign of short-term exhaustion. On the hourly chart, we’ve now got the early shape of a double-top pattern forming, which often suggests a loss of bullish conviction at resistance.
Given the elevated macro risk, volatility is likely to remain high. Traders looking to participate here should consider using the Average True Range to size their stops more effectively. With the rally showing signs of fading and resistance still intact, near-term price action looks vulnerable to further cooling unless the trendline is taken out decisively.
Brent Crude (UKOIL) Daily Candle Chart
Past performance is not a reliable indicator of future results
Brent Crude (UKOIL) Hourly Candle Chart
Past performance is not a reliable indicator of future results
Disclaimer: This is for information and learning purposes only. The information provided does not constitute investment advice nor take into account the individual financial circumstances or objectives of any investor. Any information that may be provided relating to past performance is not a reliable indicator of future results or performance. Social media channels are not relevant for UK residents.
Spread bets and CFDs are complex instruments and come with a high risk of losing money rapidly due to leverage. 85.24% of retail investor accounts lose money when trading spread bets and CFDs with this provider. You should consider whether you understand how spread bets and CFDs work and whether you can afford to take the high risk of losing your money.
Disclaimer
The information and publications are not meant to be, and do not constitute, financial, investment, trading, or other types of advice or recommendations supplied or endorsed by TradingView. Read more in the Terms of Use.
Disclaimer
The information and publications are not meant to be, and do not constitute, financial, investment, trading, or other types of advice or recommendations supplied or endorsed by TradingView. Read more in the Terms of Use.