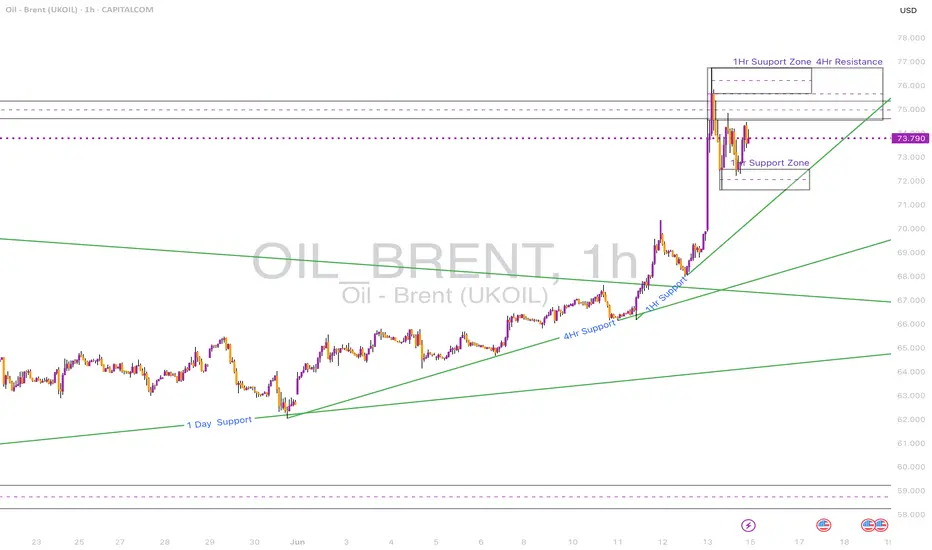
Price has aggressively broken out from the descending wedge and reached a strong 4H & 1D resistance zone between 74.50–76.00.
• 1D Chart: Sharp breakout from long-term descending trendline. Approaching resistance from Feb-April supply area.
• 4H Chart: Bullish structure confirmed by higher lows and breakout of ascending channel.
• 1H & 23m Chart: Consolidating beneath resistance, forming a triangle structure.
Key Zones:
• Support: 71.50–72.00
• Resistance: 74.50–76.00
Bias: Neutral short-term (range). Bullish if 76 is broken and held.
Disclaimer
The information and publications are not meant to be, and do not constitute, financial, investment, trading, or other types of advice or recommendations supplied or endorsed by TradingView. Read more in the Terms of Use.
Disclaimer
The information and publications are not meant to be, and do not constitute, financial, investment, trading, or other types of advice or recommendations supplied or endorsed by TradingView. Read more in the Terms of Use.