Crude oil’s conflict-driven rally may have run its course. After surging into resistance last week, Brent has now reversed sharply on signs of de-escalation in the Middle East.
Ceasefire Hopes Trigger a Sharp Reversal
Last week we highlighted that crude oil’s rally on the back of the Middle East conflict had taken the market right into a confluent area of resistance. While prices managed to break and hold above that resistance towards the end of the week as the conflict escalated, Monday’s session saw a sharp change in tone. The market gapped higher at the open following news of President Trump’s decision to bomb Iranian nuclear facilities, but those gains quickly unravelled.
What followed was a heavy sell-off as traders responded to rumours of a ceasefire agreement and interpreted Iran’s missile strike on a US base in Qatar as a calibrated, face-saving gesture. Market participants drew parallels with the 2020 playbook, where Tehran signalled retaliation while quietly coordinating with Washington to avoid further escalation. By the close, crude had surrendered all its intraday gains, and the conflict premium began to rapidly unwind.
Brent Crude (UKOIL) Daily Candle Chart

Past performance is not a reliable indicator of future results
Bearish Engulfing Pattern Shifts Momentum
Technically, the Monday’s price action left behind a large bearish engulfing candle which is a strong reversal signal where the day’s range eclipses the trading ranges of previous sessions. In this case, the engulfing candle swallowed the prior six days of price action, reinforcing its importance. The structure of this move consisting of a gap higher followed by a persistent sell-off suggests that buyers were caught offside and forced to capitulate.
The top of Monday’s candle now marks a key short-term high. It is the point where the rally met decisive selling pressure and provides a clear reference level for traders tracking short-term momentum. With the broader trend still defined by a series of lower highs and lower lows, the failure at resistance realigns the short-term outlook with the bigger picture.
That said, this remains a highly volatile and fluid situation. Geopolitical tensions can flare up again without warning, and markets are likely to remain headline-sensitive. Traders should use tools like the average true range (ATR) to calibrate risk appropriately in this fast-moving environment.
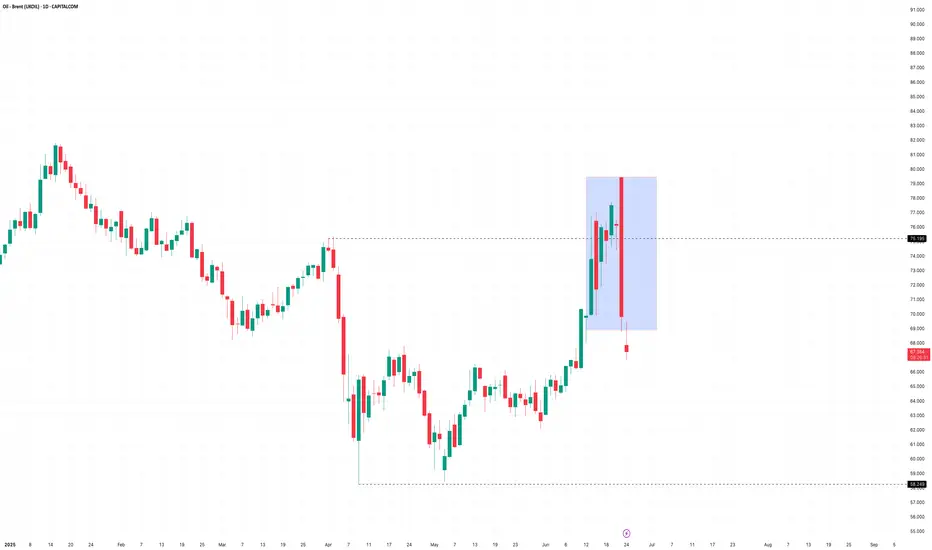
Brent Crude (UKOIL) Bearish Engulfing Pattern on Daily Candle Chart

Past performance is not a reliable indicator of future results
Disclaimer: This is for information and learning purposes only. The information provided does not constitute investment advice nor take into account the individual financial circumstances or objectives of any investor. Any information that may be provided relating to past performance is not a reliable indicator of future results or performance. Social media channels are not relevant for UK residents.
Spread bets and CFDs are complex instruments and come with a high risk of losing money rapidly due to leverage. 85.24% of retail investor accounts lose money when trading spread bets and CFDs with this provider. You should consider whether you understand how spread bets and CFDs work and whether you can afford to take the high risk of losing your money.
Ceasefire Hopes Trigger a Sharp Reversal
Last week we highlighted that crude oil’s rally on the back of the Middle East conflict had taken the market right into a confluent area of resistance. While prices managed to break and hold above that resistance towards the end of the week as the conflict escalated, Monday’s session saw a sharp change in tone. The market gapped higher at the open following news of President Trump’s decision to bomb Iranian nuclear facilities, but those gains quickly unravelled.
What followed was a heavy sell-off as traders responded to rumours of a ceasefire agreement and interpreted Iran’s missile strike on a US base in Qatar as a calibrated, face-saving gesture. Market participants drew parallels with the 2020 playbook, where Tehran signalled retaliation while quietly coordinating with Washington to avoid further escalation. By the close, crude had surrendered all its intraday gains, and the conflict premium began to rapidly unwind.
Brent Crude (UKOIL) Daily Candle Chart
Past performance is not a reliable indicator of future results
Bearish Engulfing Pattern Shifts Momentum
Technically, the Monday’s price action left behind a large bearish engulfing candle which is a strong reversal signal where the day’s range eclipses the trading ranges of previous sessions. In this case, the engulfing candle swallowed the prior six days of price action, reinforcing its importance. The structure of this move consisting of a gap higher followed by a persistent sell-off suggests that buyers were caught offside and forced to capitulate.
The top of Monday’s candle now marks a key short-term high. It is the point where the rally met decisive selling pressure and provides a clear reference level for traders tracking short-term momentum. With the broader trend still defined by a series of lower highs and lower lows, the failure at resistance realigns the short-term outlook with the bigger picture.
That said, this remains a highly volatile and fluid situation. Geopolitical tensions can flare up again without warning, and markets are likely to remain headline-sensitive. Traders should use tools like the average true range (ATR) to calibrate risk appropriately in this fast-moving environment.
Brent Crude (UKOIL) Bearish Engulfing Pattern on Daily Candle Chart
Past performance is not a reliable indicator of future results
Disclaimer: This is for information and learning purposes only. The information provided does not constitute investment advice nor take into account the individual financial circumstances or objectives of any investor. Any information that may be provided relating to past performance is not a reliable indicator of future results or performance. Social media channels are not relevant for UK residents.
Spread bets and CFDs are complex instruments and come with a high risk of losing money rapidly due to leverage. 85.24% of retail investor accounts lose money when trading spread bets and CFDs with this provider. You should consider whether you understand how spread bets and CFDs work and whether you can afford to take the high risk of losing your money.
Disclaimer
The information and publications are not meant to be, and do not constitute, financial, investment, trading, or other types of advice or recommendations supplied or endorsed by TradingView. Read more in the Terms of Use.
Disclaimer
The information and publications are not meant to be, and do not constitute, financial, investment, trading, or other types of advice or recommendations supplied or endorsed by TradingView. Read more in the Terms of Use.