Long
WTI US crude oil. Buy. Divergence. Gap fill?
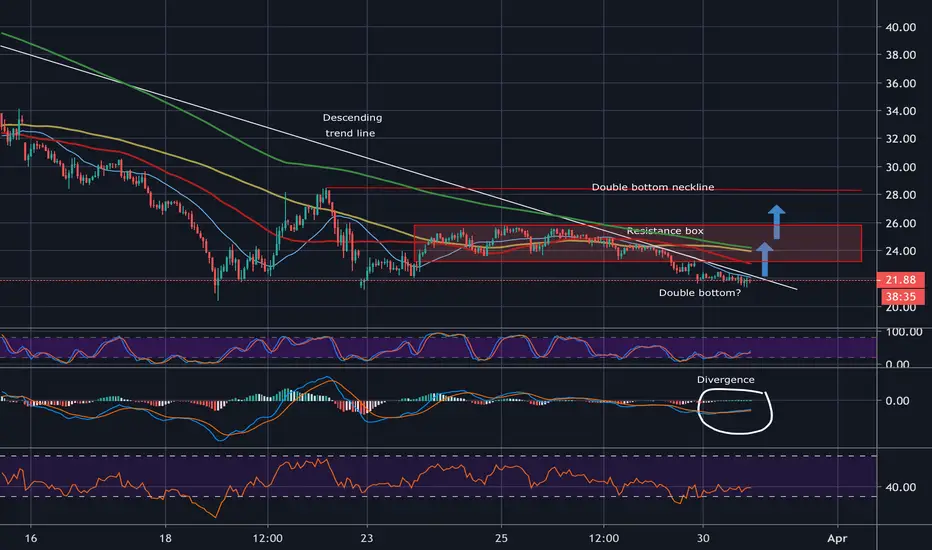
Here we can see a nice divergence of lower prices with a rising RSI and MACDH divergence on the hourly. Nice Doji reversal candle to.
Analysis of the WTI charts shows big volume on this candle to.
Is this a double bottom? Will we see a big pump up to the neckline? Resistance box to get through first. As always I'll be taking profits as we hit that and buying pullbacks again on the 5 min (or 1 min depending on momentum) charts.
Analysis of the WTI charts shows big volume on this candle to.
Is this a double bottom? Will we see a big pump up to the neckline? Resistance box to get through first. As always I'll be taking profits as we hit that and buying pullbacks again on the 5 min (or 1 min depending on momentum) charts.
Note
Stop loss at low of divergence candle (21.39) or if the MACDH turns negative againNote
First target. Gap fill at 23.09Trade closed: stop reached
Stop hit, doesn't look good for oil, when these types of divergences fail we often get a powerful move the other way. Good time to reverse the trade and go shortNote
Just a little extra comment here a week or so on. This was a real choppy trade with a string of divergences and my initial stop being hit before the powerful move upwards! Sometimes a trade has to be tried multiple times with small stop losses before the big profits come in.Disclaimer
The information and publications are not meant to be, and do not constitute, financial, investment, trading, or other types of advice or recommendations supplied or endorsed by TradingView. Read more in the Terms of Use.
Disclaimer
The information and publications are not meant to be, and do not constitute, financial, investment, trading, or other types of advice or recommendations supplied or endorsed by TradingView. Read more in the Terms of Use.