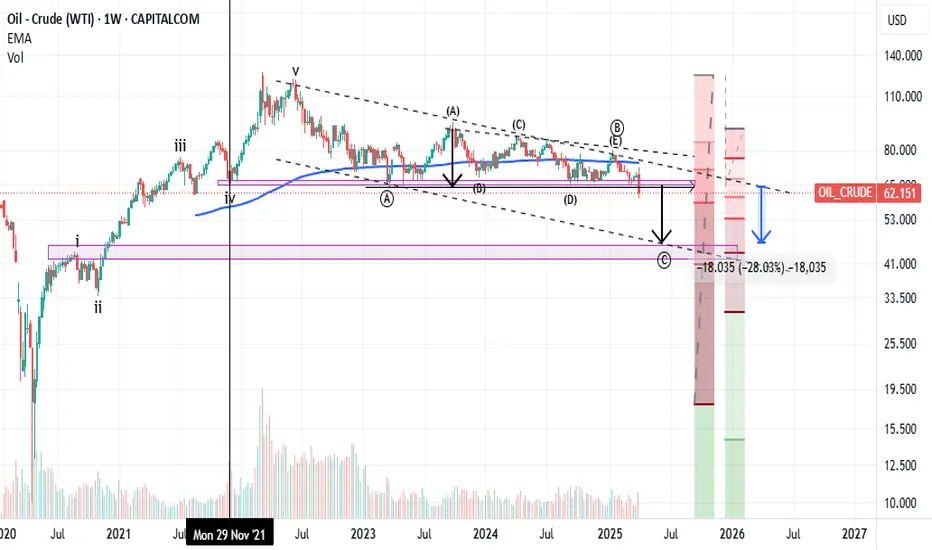
Last Friday, April 4th, 2025, crude oil decisively broke below a key long-term support level that had held strong since late November 2021.
This significant downside breakout, if confirmed, could mark a major shift in the oil market structure — potentially opening the door for a deeper decline.
Based on Elliott Wave analysis, it appears that wave B has been completed in the form of a contracting triangle, and we are now likely entering wave C. According to Fibonacci projections, wave C could extend down toward the $41–$44 range, which represents roughly a 28% drop from current levels.
From a chart pattern perspective, price action has also broken down from a descending triangle — a classic bearish pattern — with a projected target that aligns closely with the Elliott Wave count around $44.
Moreover, this entire bearish move, which began in early June 2022, fits neatly within a descending channel — further validating the confluence of technical signals.
Breaking below such a well-established support zone alone could be a strong bearish signal. But when this is backed by Elliott Wave structure, pattern projection, and broader macroeconomic concerns, it suggests a high-probability short opportunity in crude oil.
Related publications
Disclaimer
The information and publications are not meant to be, and do not constitute, financial, investment, trading, or other types of advice or recommendations supplied or endorsed by TradingView. Read more in the Terms of Use.
Related publications
Disclaimer
The information and publications are not meant to be, and do not constitute, financial, investment, trading, or other types of advice or recommendations supplied or endorsed by TradingView. Read more in the Terms of Use.