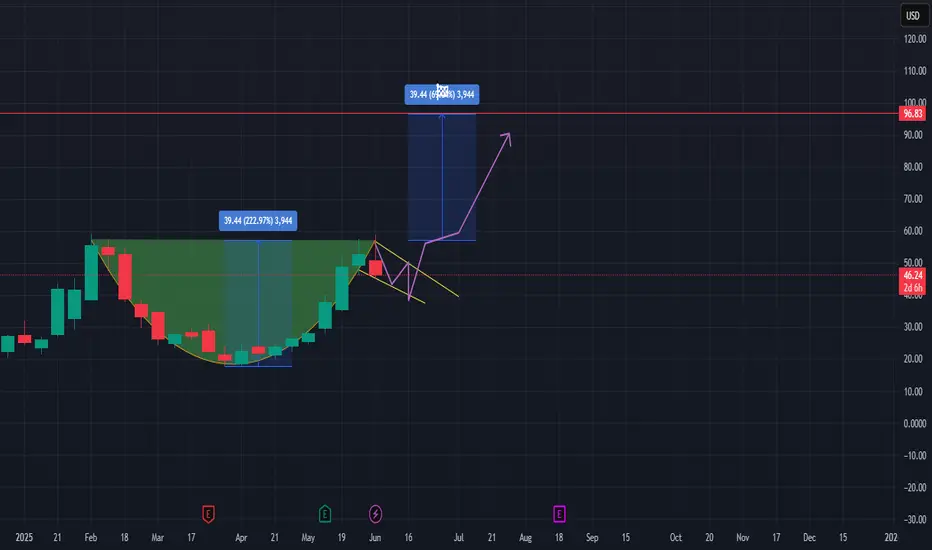
Today we are analysing Oklo Inc stock on a weekly timeframe.
We see there is a cup and handle pattern formed, a strong bullish continuation pattern.
This pattern often signals a strong move higher once confirmed.
We see the price gets rejected at around £53.19 which creates a rounded bottom signalling the 'cup' part of the pattern.
The price eventually rallies back to retest the resistance completing the right side of the cup.
A handle forms just beneath this resistance which is shown with descending candles as a short term pullback indicating consolidation before a potential breakout.
Enter after the breakout is confirmed.
💥 Free signals and ideas ➡ t.me/vfinvestment
Disclaimer
The information and publications are not meant to be, and do not constitute, financial, investment, trading, or other types of advice or recommendations supplied or endorsed by TradingView. Read more in the Terms of Use.
💥 Free signals and ideas ➡ t.me/vfinvestment
Disclaimer
The information and publications are not meant to be, and do not constitute, financial, investment, trading, or other types of advice or recommendations supplied or endorsed by TradingView. Read more in the Terms of Use.