A 10% rally is about to happen in OMC
Looking at OMC chart, my first reaction is mixed.
On one side, the stock has clearly been in a long-term uptrend since 2020 (higher lows, higher highs). That usually gives me confidence as an investor. But at the same time, there are plenty of sideways phases where the price just goes nowhere. Those ranges always test your patience, and they can trick you into buying too early.
I’m feeling both curious and cautious. Curious because the stock is almost breaking out of another rectangle pattern, cautious because I’ve seen how often those breakouts can be fake. But dudes, if the breakout is fake be ready to short hard! Look at the 2023 example :)
Pattern Recognition
This chart is a small rectangle bible. Let’s walk through the main ones:
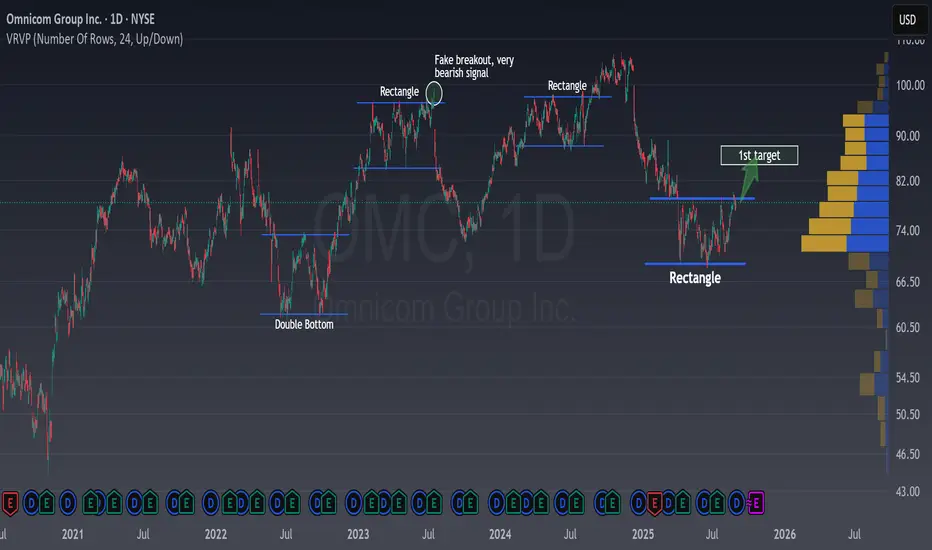
Double Bottom (2022): The stock formed two lows around the same level, then bounced hard. A double bottom is a reversal signal, like the market saying “I’ve had enough of falling.” It worked beautifully here and the classic 100% price target worked just nice.
Rectangles (several times: 2022, 2023, and now 2025): A rectangle means the stock is consolidating (similar to a double bottom), buyers and sellers are locked in a battle inside a narrow range. But the breakout can go either way, which makes it tricky for most people. In fact, everyone is trading in a range because no one is sure about the upcoming trend, so let's say we have a tie between buyers and sellers now.
Fake Breakout (2023): This is my favorite moment on the chart. Price looked like it was breaking higher, lured in the optimistic traders, and then collapsed hard. A fake breakout is one of the most bearish signals you can get, but spotting it in real time is not easy. Statistically, though, it works very well.
👉 Current Situation: Once again, we’re in a rectangle. If the price breaks to the upside the first obvious target is around $82. It’s not a huge distance, but for a short-term trader, it’s a clean opportunity with tight risk.
Analyst and Fundamental Context
Analyst price targets for Omnicom are generally in the $90–95 range, higher than today’s price around $78. That tells me the bigger picture view is still bullish.
My take is a bit different: I’m not looking for $95 right now. I’m looking for a tactical move, a short-term opportunity where the risk is small, and the reward is clear.
In other words, analysts see the marathon, I just want to sprint the next 10%.
Investment Idea
Rectangles are powerful zones. They represent accumulation or distribution, where the market pauses before deciding its next big move. A breakout can happen in either direction, so the golden rule is caution. But when you see a fake breakout, like the one in 2023, it often sets up an amazing reversal the other way.
👉 Those moments are rare, but statistically very strong.
Right now, the stock is ready to break out upward from its latest rectangle. The first target is $82, which could deliver nearly a 10% return in just a few weeks. The beauty is in the risk/reward: if price falls back into the rectangle, the trade idea is no longer valid, so the stop is clear and close.
That means I’m risking little for the chance to gain a lot.
This is the kind of setup I like: simple, defined, and fast. Not a long-term bet, but a short-term trade with discipline and clear exit rules.
Looking at
On one side, the stock has clearly been in a long-term uptrend since 2020 (higher lows, higher highs). That usually gives me confidence as an investor. But at the same time, there are plenty of sideways phases where the price just goes nowhere. Those ranges always test your patience, and they can trick you into buying too early.
I’m feeling both curious and cautious. Curious because the stock is almost breaking out of another rectangle pattern, cautious because I’ve seen how often those breakouts can be fake. But dudes, if the breakout is fake be ready to short hard! Look at the 2023 example :)
Pattern Recognition
This chart is a small rectangle bible. Let’s walk through the main ones:
Double Bottom (2022): The stock formed two lows around the same level, then bounced hard. A double bottom is a reversal signal, like the market saying “I’ve had enough of falling.” It worked beautifully here and the classic 100% price target worked just nice.
Rectangles (several times: 2022, 2023, and now 2025): A rectangle means the stock is consolidating (similar to a double bottom), buyers and sellers are locked in a battle inside a narrow range. But the breakout can go either way, which makes it tricky for most people. In fact, everyone is trading in a range because no one is sure about the upcoming trend, so let's say we have a tie between buyers and sellers now.
Fake Breakout (2023): This is my favorite moment on the chart. Price looked like it was breaking higher, lured in the optimistic traders, and then collapsed hard. A fake breakout is one of the most bearish signals you can get, but spotting it in real time is not easy. Statistically, though, it works very well.
👉 Current Situation: Once again, we’re in a rectangle. If the price breaks to the upside the first obvious target is around $82. It’s not a huge distance, but for a short-term trader, it’s a clean opportunity with tight risk.
Analyst and Fundamental Context
Analyst price targets for Omnicom are generally in the $90–95 range, higher than today’s price around $78. That tells me the bigger picture view is still bullish.
My take is a bit different: I’m not looking for $95 right now. I’m looking for a tactical move, a short-term opportunity where the risk is small, and the reward is clear.
In other words, analysts see the marathon, I just want to sprint the next 10%.
Investment Idea
Rectangles are powerful zones. They represent accumulation or distribution, where the market pauses before deciding its next big move. A breakout can happen in either direction, so the golden rule is caution. But when you see a fake breakout, like the one in 2023, it often sets up an amazing reversal the other way.
👉 Those moments are rare, but statistically very strong.
Right now, the stock is ready to break out upward from its latest rectangle. The first target is $82, which could deliver nearly a 10% return in just a few weeks. The beauty is in the risk/reward: if price falls back into the rectangle, the trade idea is no longer valid, so the stop is clear and close.
That means I’m risking little for the chance to gain a lot.
This is the kind of setup I like: simple, defined, and fast. Not a long-term bet, but a short-term trade with discipline and clear exit rules.
⚡ Trading is not about luck or patience. Is about skills and knowledge. ⚡
I share my ideas, returns and knowledge here:
📚 👉 topchartpatterns.substack.com/subscribe 👈📚
🤝 Business contact: info@topchartpatterns.com
I share my ideas, returns and knowledge here:
📚 👉 topchartpatterns.substack.com/subscribe 👈📚
🤝 Business contact: info@topchartpatterns.com
Related publications
Disclaimer
The information and publications are not meant to be, and do not constitute, financial, investment, trading, or other types of advice or recommendations supplied or endorsed by TradingView. Read more in the Terms of Use.