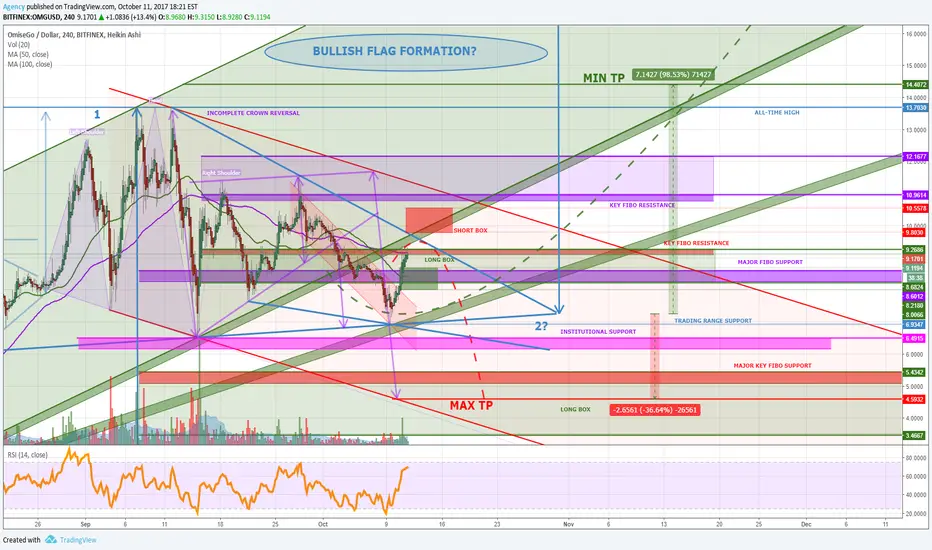
OmiseGO looks to be forming two bullish structures on the 4HR data, although a possible completion of the crown reversal is still possible. We seem to be in a downtrend channel, so buying is countercyclical until we see a puncture of the descending channel. Breaching the bottom of the flag could create the conditions necessary for a falling wedge reversal, with similar TP levels. Breaking the newly created trendline could be an early warning signal for further downward pressure.
The bullish flag sets us with a MIN TP of $14.40, MID TP of $18.14, and a MAX TP of $20.58
The crown reversal could push price as low as $4.59.
Key levels to watch to the downside:
- Trading range support at $6.93
- A breach of the flag to the downside could unlock the falling wedge pattern, with institutional buying or selling at $6.49 (fundamentals and market conditions support buying at the moment).
- Major key fibo support at $5.43
Key levels to watch to the upside:
- Key fibo resistance at $9.26
- Fibo resistance sell zone between $10.96 to $12.16
- All-time high at $13.70
This is literally a minefield so trade with care and take you time…GLWT. As always, I'll be updating this thread and posting trades.
-Erik
Trade active
Ok, so the key fibo was nice and strong so we got rejected and reentered the long box. I expect down to the flag or wedge line we have on the chart.Trade closed: stop reached
Trade active
Note
Got stopped yesterday risk free. Re-entered and almost got stopped out at a loss :OWe are doing better today, but I've got it moved to risk free again...so...lets see what happens.
Note
Also, we breached the trading range support on the other chart. Note
SIT. REP.Note
One more update: take a look at this chart...If we breach the major key fibo level (0.618 of the bearish swing) it is unlikely that we will set new all-time highs in this pair until we see a deeper correction. SO...if we are hoping for a structural wave 3 in OMGUSD we will need the strength to flow from BTCUSD and that means a return to some kind of mimicry. We will also need to pay attention to price action around the major fibo int he OMGBTC chart closely. That's all for now.
Note
There is an uptrend line ahead.Still no breach of the major key-fibo here
Note
RSI is getting overbought pretty fast here... I think I'll hold on! HmmmmmTrading range resistance is still in play here
Trade closed manually
Note
Watching this... too risky to short on exit tho I think.Note
Things are still static today....waiting for a break to the upside or downside.Note
Uptrend line is breached!Note
Broke a few supports today...Uhoh....
Note
Double bottom? I think we'll see further downward pressure to form the big falling wedge.Note
Still fishing for the bottom. We should see a really nice countercyclical bounce here soon (i'll post a dedicated thread when I see something). For now, here are some lines.Note
Oups...above is ripple. Here is OMG...lolNote
Broke the bull flag line again!Harmonic/fibo extension targets are next in the other chart
Note
Hit the hourly fibo extension and broke out of the flag! This is still a countercyclical context. Will post a new thread tomorrow.Note
We are at a huge classic fibo resistance area in the USD chart, where we see confluence: a major and minor fibo resistance (two purple lines). The fibo extension is acting as support for now, and there is excitement that we broke out of the flag. BUT! This can fall apart rather quickly. RSI is overbought in both charts...let's watch for a sell signal.Note
RSI is making a sell signal in the 4HR.Note
Note
Bear flag? The big flag line could stop the bloodletting.RSI is making a sell signal here
Note
Major key fibo just got punched again,
Trade active
Trade closed: stop reached
HahaNote
The flag was invalidated, but the support breaks make a short trade possible. Aiming for the extension which is also the trading range support. Then I'll look to open a long from support! :)Trade closed manually
On BTC strength. But I'm not ready to go long yet.Note
FYI: Small timeframe shows a bounce from the bottom bull flag line. 4HR RSI is not friendly yet, but it's time to watch.Note
This is still shorting territory, as structural bull flag invalidated: Trading range support broken, which was a fibo extension. We still have the structural falling wedge: Next trading range support is at $6.5, followed by an hourly fibo extension at $6.
Trade closed: target reached
Short closed now.Note
Wow that was a big sell off. Short term bounce next? I'm too scared to trade in this countercyclical context tho :P4HR:
Note
RSI is making a selling signal for the next selloff wave?Note
Very nice bounce! Is this the bottom?Related publications
Disclaimer
The information and publications are not meant to be, and do not constitute, financial, investment, trading, or other types of advice or recommendations supplied or endorsed by TradingView. Read more in the Terms of Use.
Related publications
Disclaimer
The information and publications are not meant to be, and do not constitute, financial, investment, trading, or other types of advice or recommendations supplied or endorsed by TradingView. Read more in the Terms of Use.