Will this bounce and continue?
The current situation:
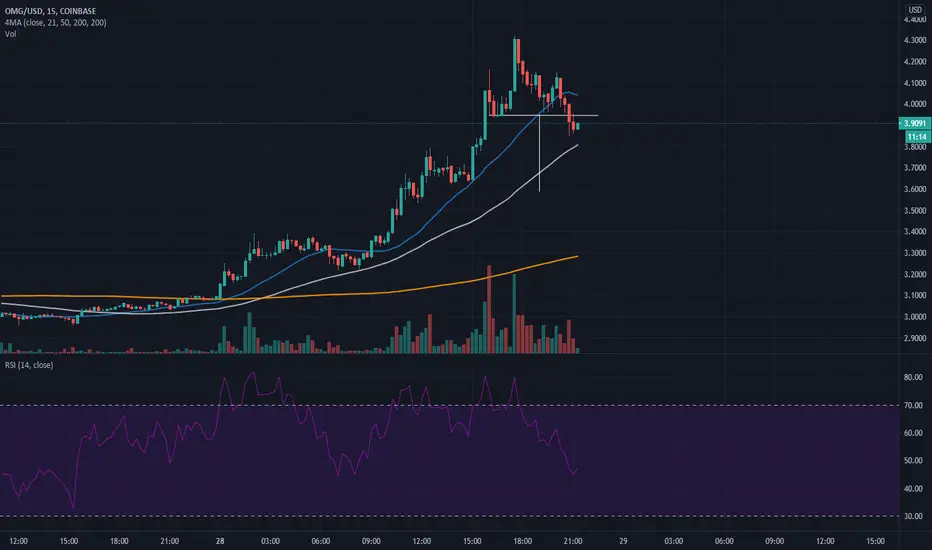
1. Price action has ran up to about 4.3 USD today and now has formed a head and shoulders, a bearish pattern, on the 15M chart. The neckline of the pattern is about 3.95, which the price action has now broken below and the measured target is about 3.6, which is about where the 1HR moving average is.
The 4 and 6HR 200MA are at about 3.8 currently and can be resistance once price action closes below it.
2. RSI was just or is still overbought on the 1, 4 and 6HR charts. So possible bearish divergence may still occur even if the price action makes an equal or higher high. In that case, another pullback may be expected after.
The (short-term) bullish case: price action bounces off the 1HR 21MA and retest the previous high of about 4.3 USD
The bearish case: price action does not get a strong bounce at the 1HR 21MA and continues falling.
Either of these are VERY risky moves to get in on.
*Let me know in the comment section if you agree or disagree, would love to hear your ideas too.
*These are purely my speculations and not financial advice. You should always do your own due diligence before trading or investing.
Disclaimer
The information and publications are not meant to be, and do not constitute, financial, investment, trading, or other types of advice or recommendations supplied or endorsed by TradingView. Read more in the Terms of Use.
Disclaimer
The information and publications are not meant to be, and do not constitute, financial, investment, trading, or other types of advice or recommendations supplied or endorsed by TradingView. Read more in the Terms of Use.