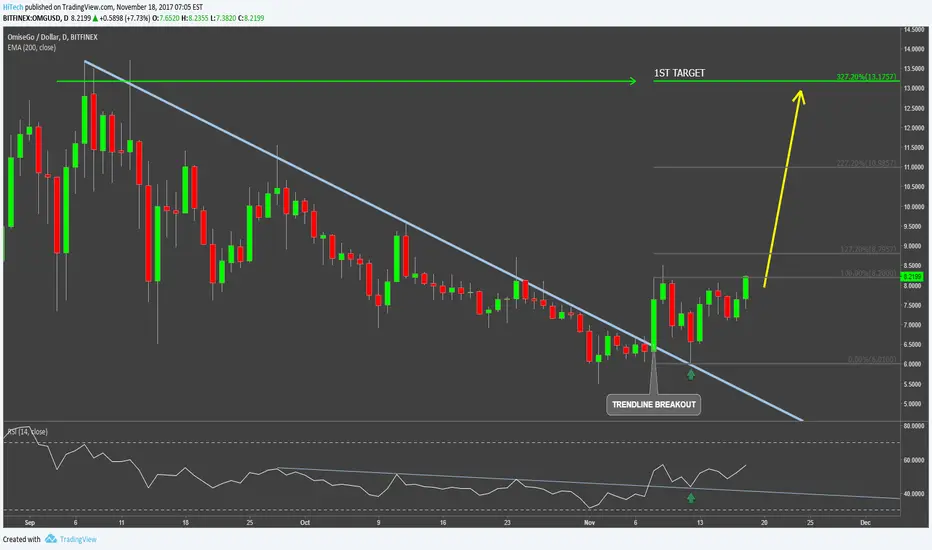
OmiseGo showing some strength during the past week. It has managed to break above the downtrend trendline and on a corrective wave down it rejected it. Same happened with the RSI Oscillator breaking the trendline and then rejecting it.
Overall there are signs of emerging uptrend with the first target being near the previous resistance, the all-time high, which is at $13 area. It corresponds with the 327.2% Fibonacci retracement applied to the corrective wave after the trendline breakout.
Daily close below $6 support should invalidate bullish outlook and could extend the consolidation.
Note
OmiseGo Gaining Momentum, time to rise!Trade active
Trade closed: target reached
While the $10 resistance area is holding there is the risk of correctionTrade active
should get now to the target and potentially beyondNote
OmiseGo rejected final resistanceDisclaimer
The information and publications are not meant to be, and do not constitute, financial, investment, trading, or other types of advice or recommendations supplied or endorsed by TradingView. Read more in the Terms of Use.
Disclaimer
The information and publications are not meant to be, and do not constitute, financial, investment, trading, or other types of advice or recommendations supplied or endorsed by TradingView. Read more in the Terms of Use.