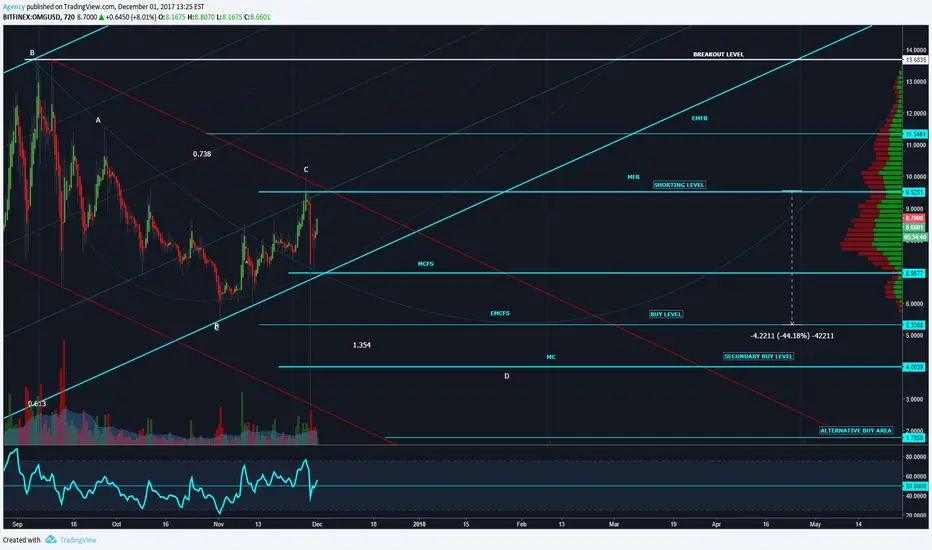
This market was struggling to perform compared to other instruments over the last few months. In August OmiseGo was on fire. We tagged the major fibo resistance (a shorting level where longer term market participants decide to stay or leave the market) and collapsed. This is a sign of weakness, even tho we formed a bullish wick. I can see the uptrend line getting busted and visiting the edge of the major classical support at $5.33. Depending on how price action goes, we may see max consolidation at $4. Be advised, trading below max consolidation could take this market down below $2 before it starts pushing upwards.
Alternatively, if we break the descending channel, we'll want to get long!
Alternatively, if we break the descending channel, we'll want to get long!
Note
Nice rally, and we broke the downtrend channel in the USD chart! But we are still struggling in the right chart, so its not a market performer but riding on BTC strength. Let's wait and see if it was a fakeout.Note
Here's the moment we need to watch the right chart.Note
Note
A full retrace? Holy crap.The USD chart has new lines now:
Note
Related publications
Disclaimer
The information and publications are not meant to be, and do not constitute, financial, investment, trading, or other types of advice or recommendations supplied or endorsed by TradingView. Read more in the Terms of Use.
Related publications
Disclaimer
The information and publications are not meant to be, and do not constitute, financial, investment, trading, or other types of advice or recommendations supplied or endorsed by TradingView. Read more in the Terms of Use.