This chart is a technical analysis idea for the OM/USDT pair on the daily timeframe from TradingView. Here's a breakdown of the idea:
🔍 Overview
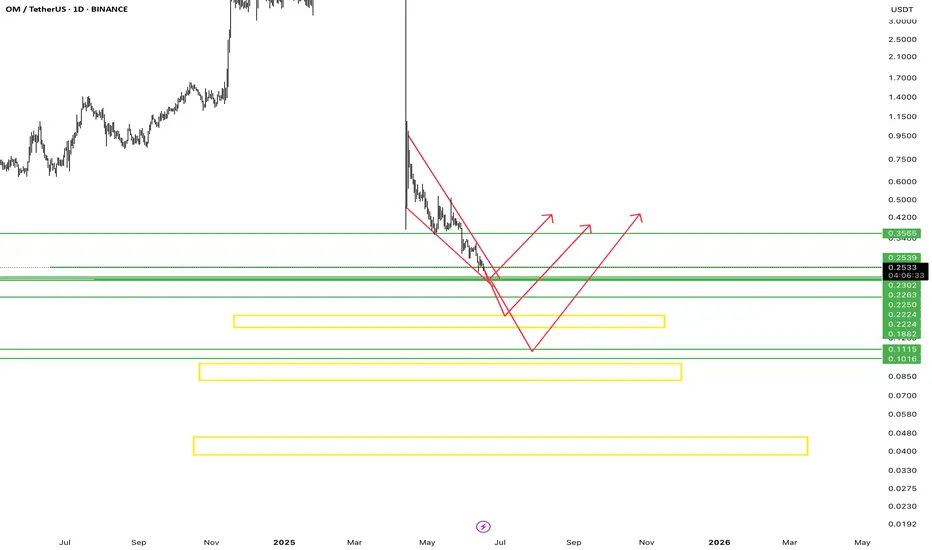
Pair: OM/USDT
Exchange: Binance
Timeframe: 1D (Daily)
📉 Current Market Context
The price is in a strong downtrend, forming a falling wedge (marked with red trendlines), which is typically a bullish reversal pattern.
Price is currently around $0.2539.
📊 Key Levels (Support Zones in Green)
$0.2539 (Current Price)
$0.2390
$0.2285
$0.2250
$0.2224
$0.2100
$0.1882
$0.1115
$0.1016
These green lines represent support zones—potential reversal areas if price falls further.
🟨 Yellow Boxes
These are higher time frame demand zones or accumulation areas, suggesting stronger possible reversal points if price drops deeper.
Placed between $0.14 - $0.04 zone.
📈 Red Arrows
Indicate possible reversal paths:
A bounce from current levels
A dip into deeper support zones before bouncing
A flush into yellow zones before reversal
🗓️ Time-Based Prediction
The note says:
“19, 21, 23, and 30th June might be positive for OM”
This suggests a time cycle forecast—the analyst expects bullish price action on or around these dates, possibly based on astro-cycles, Gann analysis, or time symmetry.
"Despite expecting lower prices, the setup signals that investors are preparing for accumulation—especially near key dates and support levels."
✅ Summary
Wait for wedge breakout confirmation to go long.
Key bullish reversal dates: June 19, 21, 23, and 30
Multiple layered supports and demand zones to watch.
🔍 Overview
Pair: OM/USDT
Exchange: Binance
Timeframe: 1D (Daily)
📉 Current Market Context
The price is in a strong downtrend, forming a falling wedge (marked with red trendlines), which is typically a bullish reversal pattern.
Price is currently around $0.2539.
📊 Key Levels (Support Zones in Green)
$0.2539 (Current Price)
$0.2390
$0.2285
$0.2250
$0.2224
$0.2100
$0.1882
$0.1115
$0.1016
These green lines represent support zones—potential reversal areas if price falls further.
🟨 Yellow Boxes
These are higher time frame demand zones or accumulation areas, suggesting stronger possible reversal points if price drops deeper.
Placed between $0.14 - $0.04 zone.
📈 Red Arrows
Indicate possible reversal paths:
A bounce from current levels
A dip into deeper support zones before bouncing
A flush into yellow zones before reversal
🗓️ Time-Based Prediction
The note says:
“19, 21, 23, and 30th June might be positive for OM”
This suggests a time cycle forecast—the analyst expects bullish price action on or around these dates, possibly based on astro-cycles, Gann analysis, or time symmetry.
"Despite expecting lower prices, the setup signals that investors are preparing for accumulation—especially near key dates and support levels."
✅ Summary
Wait for wedge breakout confirmation to go long.
Key bullish reversal dates: June 19, 21, 23, and 30
Multiple layered supports and demand zones to watch.
Markets move in angles. I follow the lines.
Disclaimer
The information and publications are not meant to be, and do not constitute, financial, investment, trading, or other types of advice or recommendations supplied or endorsed by TradingView. Read more in the Terms of Use.
Markets move in angles. I follow the lines.
Disclaimer
The information and publications are not meant to be, and do not constitute, financial, investment, trading, or other types of advice or recommendations supplied or endorsed by TradingView. Read more in the Terms of Use.