📊 
 OMUSDT HOLDING STRONG ABOVE 50-DAY MA!
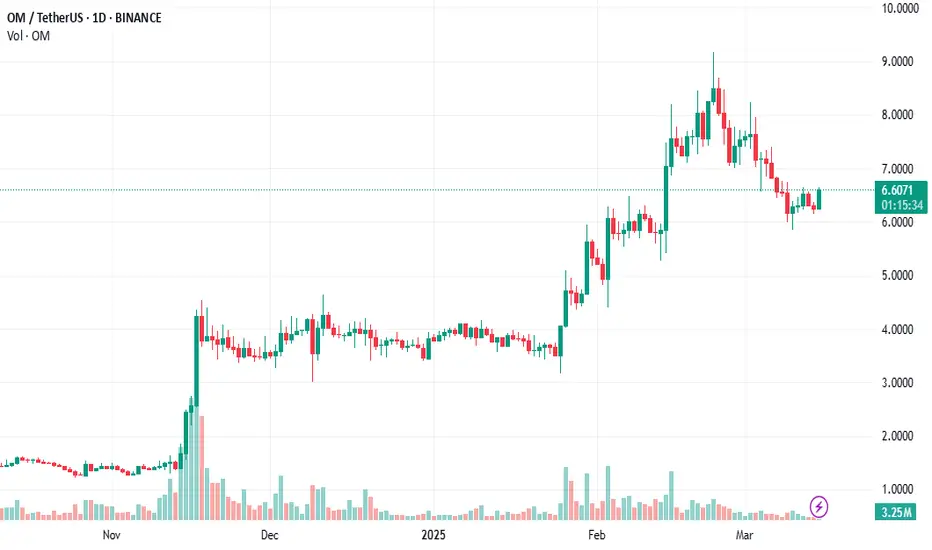
The 50-day Moving Average has been a solid support for $OMUSDT.
🔹 Price holding above MA = Bullish trend
🔹 Historically, this signals further upside
🔹 Next target: $6.75 resistance
Are you long or short? Let’s discuss. 👇
The 50-day Moving Average has been a solid support for $OMUSDT.
🔹 Price holding above MA = Bullish trend
🔹 Historically, this signals further upside
🔹 Next target: $6.75 resistance
Are you long or short? Let’s discuss. 👇
Disclaimer
The information and publications are not meant to be, and do not constitute, financial, investment, trading, or other types of advice or recommendations supplied or endorsed by TradingView. Read more in the Terms of Use.
Disclaimer
The information and publications are not meant to be, and do not constitute, financial, investment, trading, or other types of advice or recommendations supplied or endorsed by TradingView. Read more in the Terms of Use.