ONDOUSDT Daily Chart Analysis | Momentum Shift & Breakout Levels
🔍 Let’s dive into the ONDO/USDT daily chart and break down the latest momentum signals, key breakout areas, and targets for bulls.
⏳ Daily Chart Overview
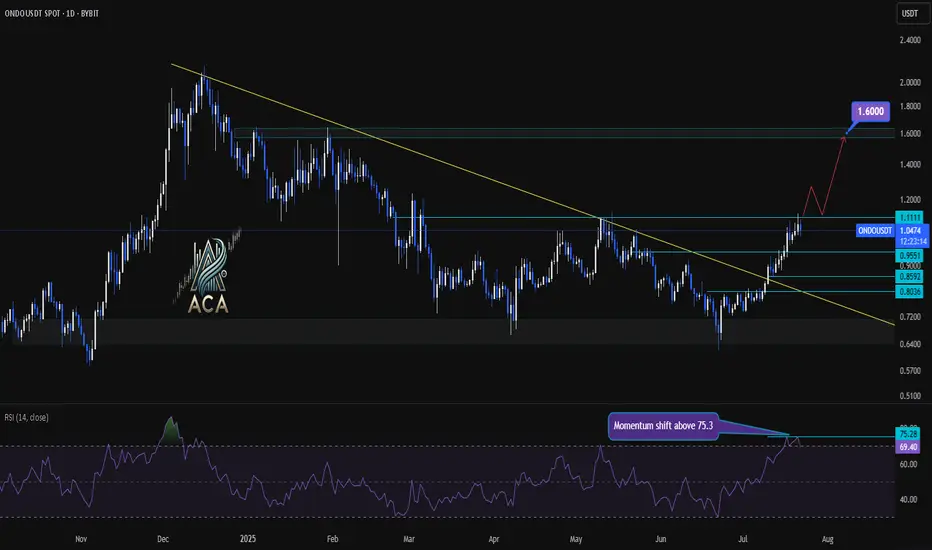
The daily trend shows significant recovery after prolonged downward pressure, with price action now testing critical resistance levels. A key descending trend line has recently been challenged, highlighting a potential shift in market structure.
🔺 Bullish Setup
- Momentum Trigger: The RSI has closed above 75.3, signaling a strong momentum shift and upping the odds for continued upside.
- Breakout Confirmation: Watch for a daily candle close above the $1.1111 resistance level. This would confirm a bullish breakout and could serve as a solid trigger for further upside.
- Trend Line Dynamics: The price has decisively broken above the major descending trend line, which had capped rallies for months—removing a significant area of supply and emboldening bulls.
- Upside Target: Once confirmed, this setup opens the door for an advance towards the $1.60 area, where the next major resistance sits.
📊 Key Highlights
- Daily RSI closing above 75.3 reflects strong market momentum and buyer dominance.
- A daily candle close above $1.1111 can be used as a bullish trigger.
- The long-term descending trend line has been broken, indicating a major momentum shift.
- Immediate upside target stands at $1.60, representing a clear resistance level for profits or further evaluation.
🚨 Conclusion
Momentum is clearly shifting in favor of the bulls as technical barriers fall by the wayside. For traders looking to position long, confirmation above $1.1111 combined with the powerful RSI reading sets the stage for a move towards $1.60—keep these levels on your radar as the setup plays out!
🔍 Let’s dive into the ONDO/USDT daily chart and break down the latest momentum signals, key breakout areas, and targets for bulls.
⏳ Daily Chart Overview
The daily trend shows significant recovery after prolonged downward pressure, with price action now testing critical resistance levels. A key descending trend line has recently been challenged, highlighting a potential shift in market structure.
🔺 Bullish Setup
- Momentum Trigger: The RSI has closed above 75.3, signaling a strong momentum shift and upping the odds for continued upside.
- Breakout Confirmation: Watch for a daily candle close above the $1.1111 resistance level. This would confirm a bullish breakout and could serve as a solid trigger for further upside.
- Trend Line Dynamics: The price has decisively broken above the major descending trend line, which had capped rallies for months—removing a significant area of supply and emboldening bulls.
- Upside Target: Once confirmed, this setup opens the door for an advance towards the $1.60 area, where the next major resistance sits.
📊 Key Highlights
- Daily RSI closing above 75.3 reflects strong market momentum and buyer dominance.
- A daily candle close above $1.1111 can be used as a bullish trigger.
- The long-term descending trend line has been broken, indicating a major momentum shift.
- Immediate upside target stands at $1.60, representing a clear resistance level for profits or further evaluation.
🚨 Conclusion
Momentum is clearly shifting in favor of the bulls as technical barriers fall by the wayside. For traders looking to position long, confirmation above $1.1111 combined with the powerful RSI reading sets the stage for a move towards $1.60—keep these levels on your radar as the setup plays out!
Disclaimer
The information and publications are not meant to be, and do not constitute, financial, investment, trading, or other types of advice or recommendations supplied or endorsed by TradingView. Read more in the Terms of Use.
Disclaimer
The information and publications are not meant to be, and do not constitute, financial, investment, trading, or other types of advice or recommendations supplied or endorsed by TradingView. Read more in the Terms of Use.