Last Time ONE Lost This Level it Dropped 70%
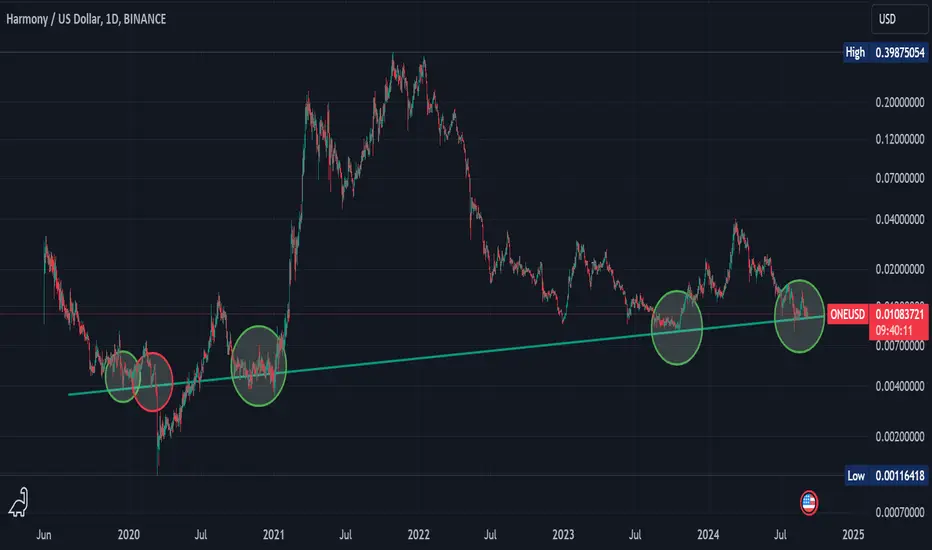
Pretty simple chart. Green line is a significant trendline of support/resistance. In March 2020 when this trendline broke, ONE dropped around 70%.
Will it hold here? Time will tell!
Will it hold here? Time will tell!
Disclaimer
The information and publications are not meant to be, and do not constitute, financial, investment, trading, or other types of advice or recommendations supplied or endorsed by TradingView. Read more in the Terms of Use.
Disclaimer
The information and publications are not meant to be, and do not constitute, financial, investment, trading, or other types of advice or recommendations supplied or endorsed by TradingView. Read more in the Terms of Use.