Technical analysis and trading plan for the ONE/USDT 1-hour chart (on Binance) by Blaž Fabjan
Descending Trading Channel:
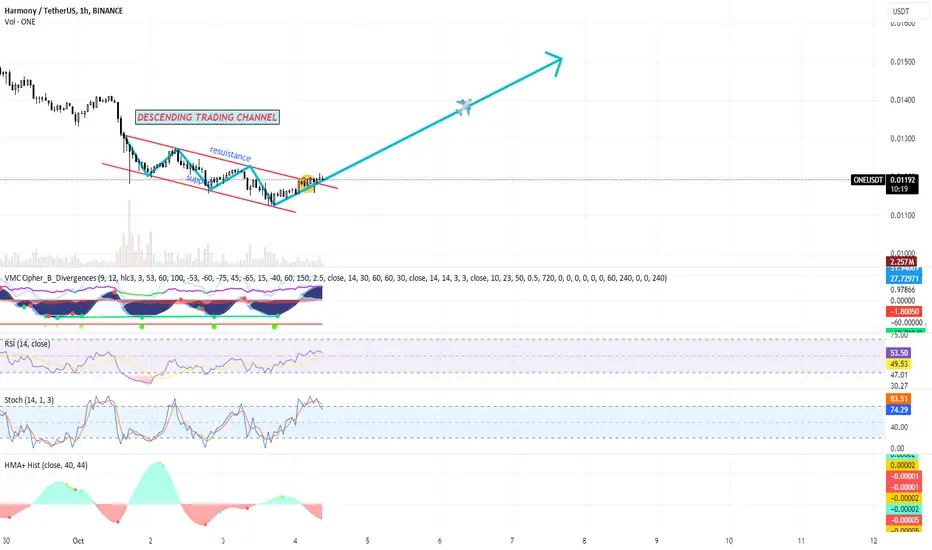
The price is currently moving within a descending trading channel, with lower highs and lower lows. This is a bearish pattern but can lead to a bullish breakout when the price breaks the upper boundary (resistance line).
The price is testing the upper boundary of the channel, which, if broken, could signal a potential upward movement.
Resistance Line:
A key resistance line is visible near 0.0120 USDT. The price has struggled to break above this level in previous attempts.
A breakout above this level with significant volume could signal a trend reversal and potential bullish momentum.
Indicators:
VMC Cipher B Indicator: Showing potential bullish momentum building up as the red momentum wave has bottomed out, signaling a possible trend reversal.
RSI (Relative Strength Index): Currently at 54.30, indicating that the market is neutral but leaning slightly bullish. It’s above the 50 line, which suggests a shift from bearish to bullish sentiment.
Stochastic RSI: Near the overbought zone, sitting at 84.47. This could mean that there might be a small correction before the price pushes higher.
HMA+ Histogram: Shows neutral sentiment, suggesting no strong trend currently. But with a bullish setup on other indicators, this could shift positively.
Volume:
Volume is moderate at 1.879M, and increasing volume during the breakout would provide confirmation of upward movement.
Trading Plan:
Bullish Scenario (Breakout Trade):
If the price breaks out above the resistance level of 0.0120 USDT with an increase in volume, this could signal a strong move upward.
Entry Point: Buy at the breakout above 0.0121 USDT with confirmation (strong bullish candle close above the resistance line and higher volume).
Target 1: 0.0140 USDT (short-term resistance).
Target 2: 0.0150 USDT (next major resistance).
Stop Loss: Set a stop loss below 0.0110 USDT (below the previous low and support of the descending channel).
Bearish Scenario (Rejection at Resistance):
If the price fails to break above the 0.0120 USDT resistance level and reverses, it could move back into the descending channel.
Entry Point: Consider shorting if the price rejects the resistance and starts to move lower, below 0.0118 USDT.
Target 1: 0.0110 USDT (previous support level).
Stop Loss: Above 0.0122 USDT (in case of a sudden bullish breakout).
Consolidation Scenario:
If the price consolidates between 0.0115 - 0.0120 USDT, wait for a clear breakout either upwards or downwards before entering a trade.
Risk Management:
Consider using a risk-reward ratio of at least 1:2 for your trades.
Position sizing should be managed to avoid overexposure. Only risk a small percentage of your portfolio on each trade.
This plan provides both bullish and bearish scenarios, with specific entry, exit points, and risk management strategies. Always ensure you monitor the price action and volume to confirm breakouts or rejections.
Descending Trading Channel:
The price is currently moving within a descending trading channel, with lower highs and lower lows. This is a bearish pattern but can lead to a bullish breakout when the price breaks the upper boundary (resistance line).
The price is testing the upper boundary of the channel, which, if broken, could signal a potential upward movement.
Resistance Line:
A key resistance line is visible near 0.0120 USDT. The price has struggled to break above this level in previous attempts.
A breakout above this level with significant volume could signal a trend reversal and potential bullish momentum.
Indicators:
VMC Cipher B Indicator: Showing potential bullish momentum building up as the red momentum wave has bottomed out, signaling a possible trend reversal.
RSI (Relative Strength Index): Currently at 54.30, indicating that the market is neutral but leaning slightly bullish. It’s above the 50 line, which suggests a shift from bearish to bullish sentiment.
Stochastic RSI: Near the overbought zone, sitting at 84.47. This could mean that there might be a small correction before the price pushes higher.
HMA+ Histogram: Shows neutral sentiment, suggesting no strong trend currently. But with a bullish setup on other indicators, this could shift positively.
Volume:
Volume is moderate at 1.879M, and increasing volume during the breakout would provide confirmation of upward movement.
Trading Plan:
Bullish Scenario (Breakout Trade):
If the price breaks out above the resistance level of 0.0120 USDT with an increase in volume, this could signal a strong move upward.
Entry Point: Buy at the breakout above 0.0121 USDT with confirmation (strong bullish candle close above the resistance line and higher volume).
Target 1: 0.0140 USDT (short-term resistance).
Target 2: 0.0150 USDT (next major resistance).
Stop Loss: Set a stop loss below 0.0110 USDT (below the previous low and support of the descending channel).
Bearish Scenario (Rejection at Resistance):
If the price fails to break above the 0.0120 USDT resistance level and reverses, it could move back into the descending channel.
Entry Point: Consider shorting if the price rejects the resistance and starts to move lower, below 0.0118 USDT.
Target 1: 0.0110 USDT (previous support level).
Stop Loss: Above 0.0122 USDT (in case of a sudden bullish breakout).
Consolidation Scenario:
If the price consolidates between 0.0115 - 0.0120 USDT, wait for a clear breakout either upwards or downwards before entering a trade.
Risk Management:
Consider using a risk-reward ratio of at least 1:2 for your trades.
Position sizing should be managed to avoid overexposure. Only risk a small percentage of your portfolio on each trade.
This plan provides both bullish and bearish scenarios, with specific entry, exit points, and risk management strategies. Always ensure you monitor the price action and volume to confirm breakouts or rejections.
Disclaimer
The information and publications are not meant to be, and do not constitute, financial, investment, trading, or other types of advice or recommendations supplied or endorsed by TradingView. Read more in the Terms of Use.
Disclaimer
The information and publications are not meant to be, and do not constitute, financial, investment, trading, or other types of advice or recommendations supplied or endorsed by TradingView. Read more in the Terms of Use.