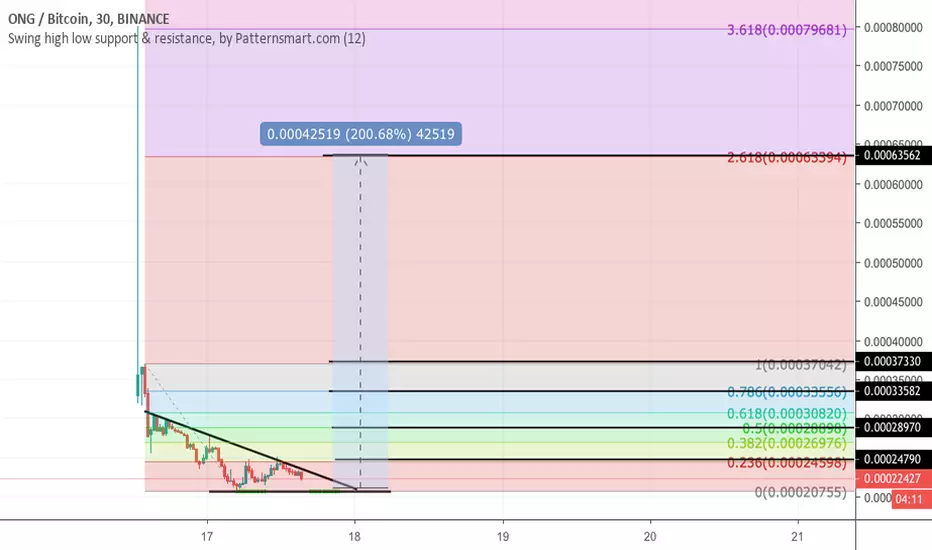
Targets are on the chart. %200 potential.
MACD Bullish cross in 1 hr chart.
Bullish divergence in 1 hr chart.
%25 down.
MACD Bullish cross in 1 hr chart.
Bullish divergence in 1 hr chart.
%25 down.
Note
Also see my RDN analysis which I told it was gonna pump hard.Note
Volume increases, price increases. What does that mean? It means we are bullish and we are going up baby.Note
There are many big gaps between sell orders until 23900 sats. After that no gap at all. What does it tell us?Note
Come on yo. You can do it.Order cancelled
Trade active
Okey I am opening the trade again. I feel something is coming :DNote
Dear FOMO, please come to ONG.Note
Maybe?Note
I entered this trade very early. I should have waited the wedge break. Still has potential to go up.Disclaimer
The information and publications are not meant to be, and do not constitute, financial, investment, trading, or other types of advice or recommendations supplied or endorsed by TradingView. Read more in the Terms of Use.
Disclaimer
The information and publications are not meant to be, and do not constitute, financial, investment, trading, or other types of advice or recommendations supplied or endorsed by TradingView. Read more in the Terms of Use.