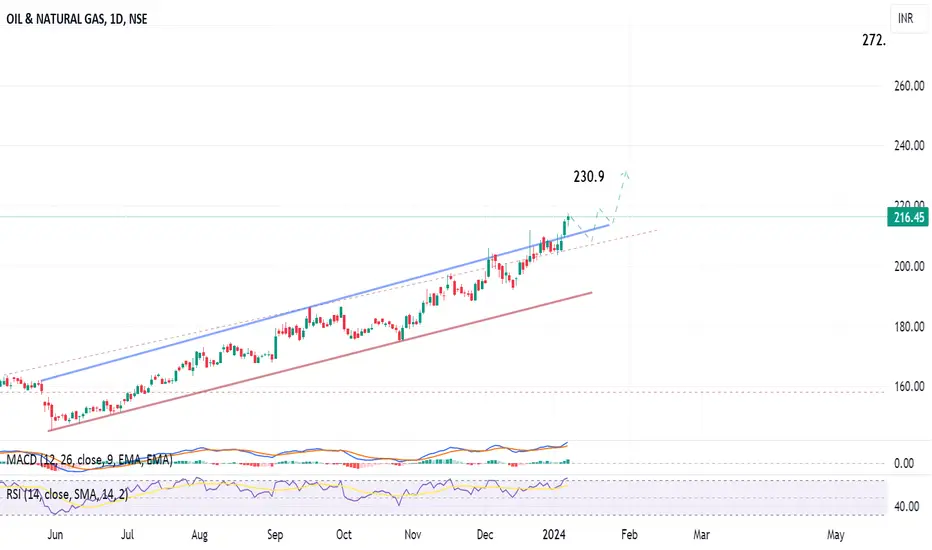
Daily chart, the stock has formed 2 patterns, rising channel and cup & handle. The first target is 230.9 and the second is 272.2 (on the weekly chart)
The technical indicator RSI is at the over-bought area, and it means some correction is due, before going up.
Stop loss at 205 - 200 to be considered.
The technical indicator RSI is at the over-bought area, and it means some correction is due, before going up.
Stop loss at 205 - 200 to be considered.
Trade active
Disclaimer
The information and publications are not meant to be, and do not constitute, financial, investment, trading, or other types of advice or recommendations supplied or endorsed by TradingView. Read more in the Terms of Use.
Disclaimer
The information and publications are not meant to be, and do not constitute, financial, investment, trading, or other types of advice or recommendations supplied or endorsed by TradingView. Read more in the Terms of Use.