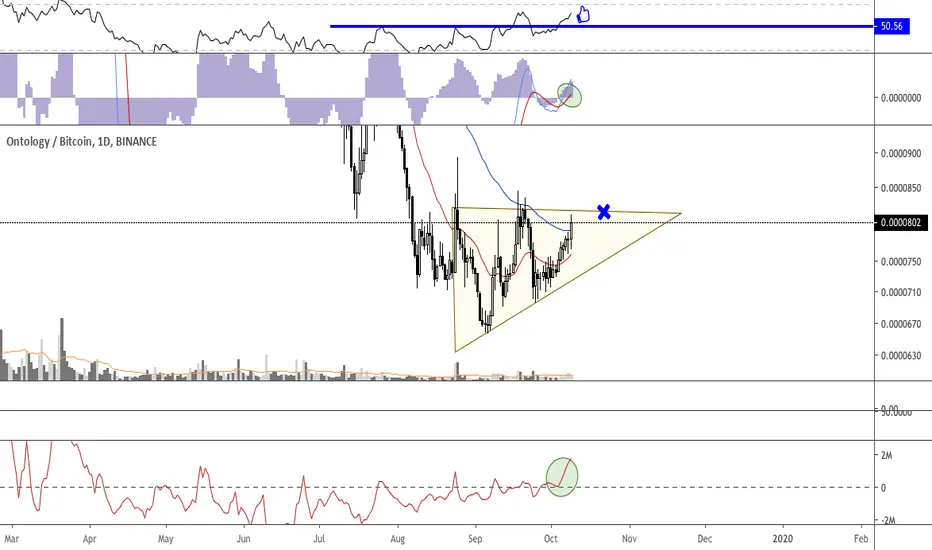
Good reversal set up drawing an ascendant triangle. Surely going sideways before breaking upwards.
MACD is on bullish side recently crossed zero line
RSI is over 50 after supporting on that level, that usually means RSI is on bullish side.
CMF oscillator crossing zero line with strength since lot time ago
PA breaking 55EMA (not happening sice FEB19) and looking the bullish crossover
Support is trendline drawing the ascending part of the triangle, target of the trade can be 900-1000 at least.
Trade active
1.- Support triangle respected
2.- 21EMA respected.
3.- RSI again supporting on 50
4.- MACD and CMF osc without changes.
Note
Market is turning bearish, and indicators this triangle are showing signs that should ring a bell in our minds.
1.- MACD crossing indicating closing long position but still on bullish territory.
2.- RSI below 50, this is bearish.
3.- CMF osc is still on bullish territory
I am going to stay in the trade but babysitting it because i will close it manually if support trendline is broken.
Disclaimer
The information and publications are not meant to be, and do not constitute, financial, investment, trading, or other types of advice or recommendations supplied or endorsed by TradingView. Read more in the Terms of Use.
Disclaimer
The information and publications are not meant to be, and do not constitute, financial, investment, trading, or other types of advice or recommendations supplied or endorsed by TradingView. Read more in the Terms of Use.