hi traders
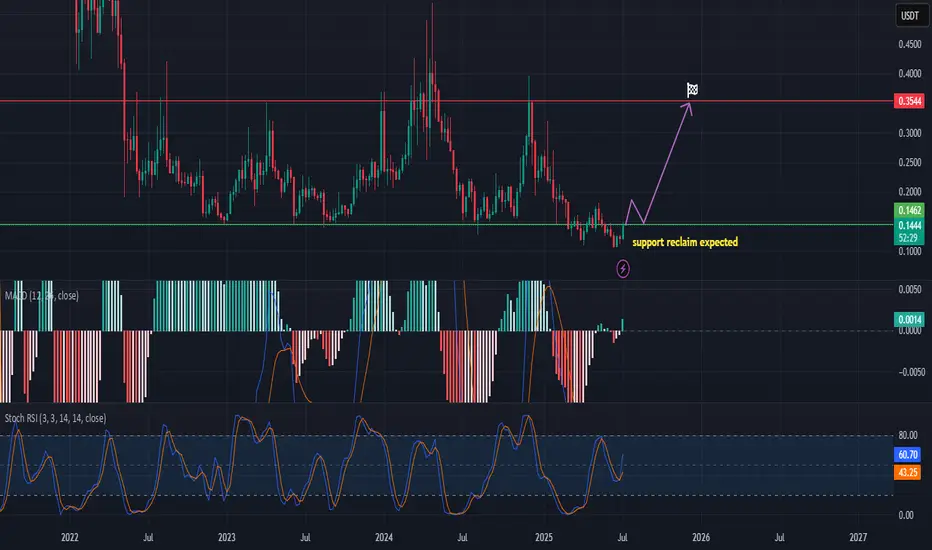
The chart suggests that ONT has reached a critical support level around $0.146, which has historically acted as a significant zone for both support and resistance. The price is currently attempting to reclaim this level, and a bullish reversal is expected if it holds.
Indicators Analysis:
MACD (Moving Average Convergence Divergence):
The MACD line has recently crossed above the signal line.
Histogram bars have flipped to green, suggesting a shift in momentum toward the upside.
This crossover is typically seen as an early bullish signal.
Stochastic RSI:
The Stochastic RSI is recovering from the oversold region.
%K line (blue) is at 60.63, and %D (orange) is at 43.22.
This upward crossover reinforces a potential trend reversal and momentum building for the bulls.
Prediction & Strategy:
The purple projection line on the chart suggests a possible upward move:
Short-term pullback and retest of the support zone (~$0.146).
Followed by a strong breakout toward the $0.35 level, marking a potential 2.4x gain from current levels.
The chart is annotated with “Support reclaim expected,” indicating that if ONT successfully retests and confirms this support, it would present a buy opportunity.
Conclusion:
📌 Buy signal is triggered if ONT/USDT confirms a reclaim of the $0.146 support level.
📈 Both the MACD and Stochastic RSI support a bullish reversal.
🎯 The next major resistance sits at $0.3544, offering significant upside potential.
Watch closely for confirmation of support holding before entering a long position.
Trade active
The price reclaimed a key support. 💥 Free signals and ideas ➡ t.me/vfinvestment
Disclaimer
The information and publications are not meant to be, and do not constitute, financial, investment, trading, or other types of advice or recommendations supplied or endorsed by TradingView. Read more in the Terms of Use.
💥 Free signals and ideas ➡ t.me/vfinvestment
Disclaimer
The information and publications are not meant to be, and do not constitute, financial, investment, trading, or other types of advice or recommendations supplied or endorsed by TradingView. Read more in the Terms of Use.