OP/USDT – 4H Chart Summary
Market Structure:
4H Timeframe:
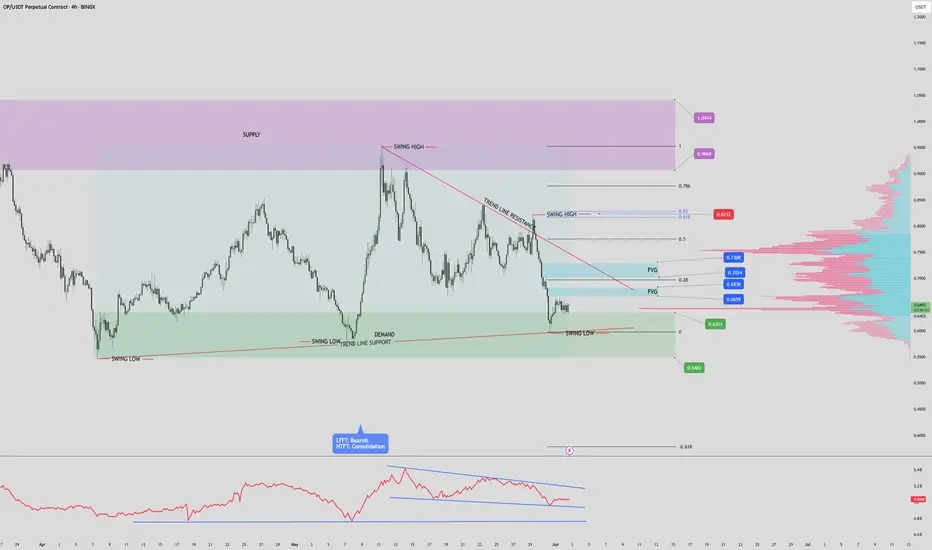
- Price consolidating within a descending triangle/wedge pattern, indicating potential buildup before a breakout.
- Lower Timeframes (1H and below): Bearish trend structure with lower highs and lows.
- OBV (On-Balance Volume): Forming a wedge—suggesting accumulation or distribution phase nearing a breakout.
Key Zones:
Demand Zone (Support):
- 0.5483 – 0.6351
This area has provided strong support historically. A clean break below could signal continuation of the larger downtrend.
Supply Zone (Resistance):
- 0.9068 – 1.0414
-Historically rejected price; high probability of reversal or consolidation if revisited.
Fair Value Gaps (FVG):
- FVG 1: 0.6659 – 0.6838
- FVG 2: 0.7024 – 0.7308
These inefficiency zones are likely to attract price if bullish momentum builds. Watch for potential short-term rejection or continuation setups here.
Volume Profile:
Strongest volume node (high liquidity zone) sits between 0.7470 – 0.8000
Suggests this area has been heavily traded and may act as magnet/resistance if approached again.
Fibonacci Confluence:
Previous swing high at 0.8232 aligns with the 0.618–0.65 golden pocket
A critical zone for potential take-profit or trend reversal on a breakout.
Scenarios:
Bullish Case:
If price holds above 0.6351 and bounces, look for:
- Retest of FVG 1, followed by FVG 2.
- Breakthrough of 0.7308 could target the golden pocket and swing high at 0.8232.
- Sustained bullish move may reach the supply zone above 0.9068.
Bearish Case:
- Breakdown below 0.6351 and especially below 0.5483 would:
- Invalidate the wedge support.
- Confirm continuation of the macro downtrend.
-Open room for new lows and bearish expansion.
Conclusion:
Price is at a key decision point inside a wedge.
Reaction at 0.6351 is critical—support bounce targets higher inefficiencies; breakdown signals deeper bearish continuation.
OBV and volume structure suggest an imminent volatility spike—prepare for a breakout.
Market Structure:
4H Timeframe:
- Price consolidating within a descending triangle/wedge pattern, indicating potential buildup before a breakout.
- Lower Timeframes (1H and below): Bearish trend structure with lower highs and lows.
- OBV (On-Balance Volume): Forming a wedge—suggesting accumulation or distribution phase nearing a breakout.
Key Zones:
Demand Zone (Support):
- 0.5483 – 0.6351
This area has provided strong support historically. A clean break below could signal continuation of the larger downtrend.
Supply Zone (Resistance):
- 0.9068 – 1.0414
-Historically rejected price; high probability of reversal or consolidation if revisited.
Fair Value Gaps (FVG):
- FVG 1: 0.6659 – 0.6838
- FVG 2: 0.7024 – 0.7308
These inefficiency zones are likely to attract price if bullish momentum builds. Watch for potential short-term rejection or continuation setups here.
Volume Profile:
Strongest volume node (high liquidity zone) sits between 0.7470 – 0.8000
Suggests this area has been heavily traded and may act as magnet/resistance if approached again.
Fibonacci Confluence:
Previous swing high at 0.8232 aligns with the 0.618–0.65 golden pocket
A critical zone for potential take-profit or trend reversal on a breakout.
Scenarios:
Bullish Case:
If price holds above 0.6351 and bounces, look for:
- Retest of FVG 1, followed by FVG 2.
- Breakthrough of 0.7308 could target the golden pocket and swing high at 0.8232.
- Sustained bullish move may reach the supply zone above 0.9068.
Bearish Case:
- Breakdown below 0.6351 and especially below 0.5483 would:
- Invalidate the wedge support.
- Confirm continuation of the macro downtrend.
-Open room for new lows and bearish expansion.
Conclusion:
Price is at a key decision point inside a wedge.
Reaction at 0.6351 is critical—support bounce targets higher inefficiencies; breakdown signals deeper bearish continuation.
OBV and volume structure suggest an imminent volatility spike—prepare for a breakout.
Trade active
Price has successfully broken below the resistance of the DEMAND zone, (0.6351)
If it succeeds in breaking below continuously this analysis is invalid.
If it begins creating higher lows then there is a chance to recover the bullish trend and could hold a spot trade till $1.
Trade closed manually
Unfortunately due to the war, the market has crashed and our OP trade has "Opted out" pun intended.
Disclaimer
The information and publications are not meant to be, and do not constitute, financial, investment, trading, or other types of advice or recommendations supplied or endorsed by TradingView. Read more in the Terms of Use.
Disclaimer
The information and publications are not meant to be, and do not constitute, financial, investment, trading, or other types of advice or recommendations supplied or endorsed by TradingView. Read more in the Terms of Use.