Hello there,
*Mars Signals Team wishes you high profits*
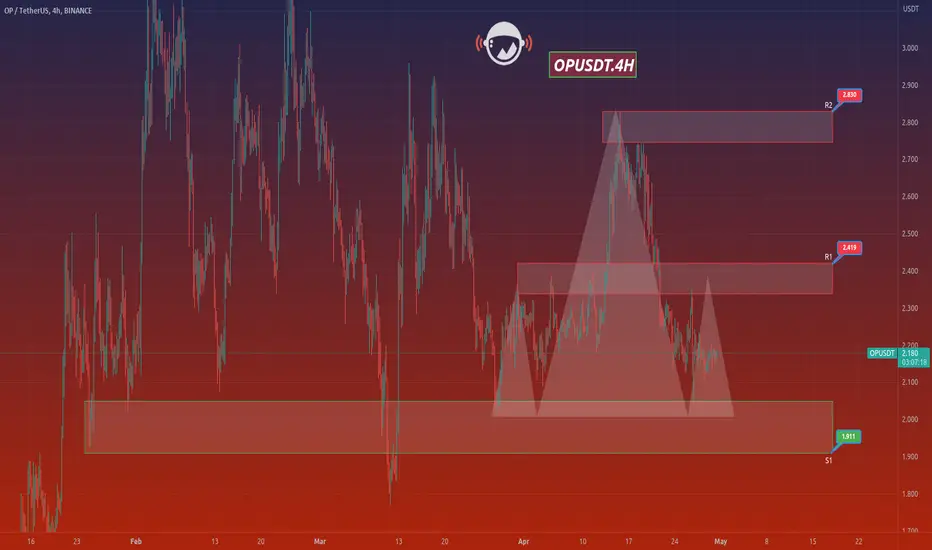
This is a 4-hour-time frame analysis for OPUSDT
In this chart, R2 and R1 are our resistance areas in which the unsuccessful triumphs of price is clearly seen. And finally at the bottom of the chart, we have S1 which is the long-term support line and contains the support of price at different points since the past. The price past trend illustrates its well support at two points at S1 and after each support, it faced more rise to higher amounts including R1 and R2. The existence of a head and shoulders pattern means that the price formed the head part of the pattern when it was rejected at R2 and now it is moving over S1 again. Hence, the price is fluctuating at this point and experience a rise up to the resistance areas. These will be the good points for saving your profits. Or if possibly the price is believed to be supported again and by rising toward R1 falling for another time, we expect the right shoulder of the pattern to be completed. But in case the price falls below the support area, then more decline happens to it. Even by more fluctuation and support above R1 area, more rise is waiting for the price. Note that it is recommended to wait for some confirmation candles and make sure of your next action in trading. In case you are interested in experiencing profitable trades and wise actions in your analyses, we have several points and tips in our updates.
Warning: This is just a suggestion and we do not guarantee profits. We advise you to analyze the chart before opening any positions.
Wish you success
*Mars Signals Team wishes you high profits*
This is a 4-hour-time frame analysis for OPUSDT
In this chart, R2 and R1 are our resistance areas in which the unsuccessful triumphs of price is clearly seen. And finally at the bottom of the chart, we have S1 which is the long-term support line and contains the support of price at different points since the past. The price past trend illustrates its well support at two points at S1 and after each support, it faced more rise to higher amounts including R1 and R2. The existence of a head and shoulders pattern means that the price formed the head part of the pattern when it was rejected at R2 and now it is moving over S1 again. Hence, the price is fluctuating at this point and experience a rise up to the resistance areas. These will be the good points for saving your profits. Or if possibly the price is believed to be supported again and by rising toward R1 falling for another time, we expect the right shoulder of the pattern to be completed. But in case the price falls below the support area, then more decline happens to it. Even by more fluctuation and support above R1 area, more rise is waiting for the price. Note that it is recommended to wait for some confirmation candles and make sure of your next action in trading. In case you are interested in experiencing profitable trades and wise actions in your analyses, we have several points and tips in our updates.
Warning: This is just a suggestion and we do not guarantee profits. We advise you to analyze the chart before opening any positions.
Wish you success
Disclaimer
The information and publications are not meant to be, and do not constitute, financial, investment, trading, or other types of advice or recommendations supplied or endorsed by TradingView. Read more in the Terms of Use.
Disclaimer
The information and publications are not meant to be, and do not constitute, financial, investment, trading, or other types of advice or recommendations supplied or endorsed by TradingView. Read more in the Terms of Use.