In month chart,K3 just break up the neck line of a potential double bottom.
It seems to be accelerating.
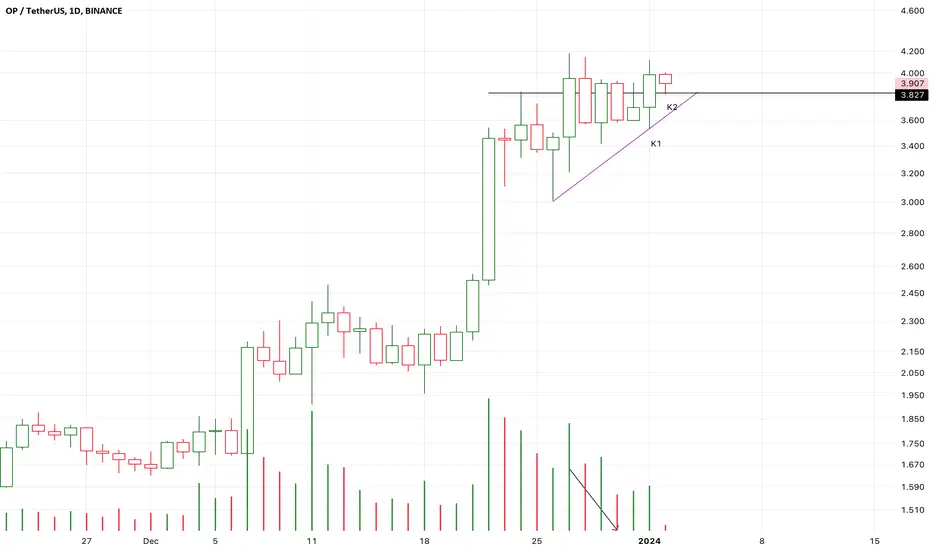
In week chart,
If K3 break up K2, that will verify the strong of the bull market.
Will the resistance stop the bullish momentum ?
I don’t know.
I will try to buy some if I found there are reasons to verify the weakness of the resistance.
It seems that the demands had absorbed the supply.
If the following candles k2 or K3 verified that,
It will be a good opportunity to buy in.
Note
From K1 to K3, it is a potential head of a short term bear market.
The supply volume is increasing, it verified the bearish advancing momentum.
K4 and K5 is a bearish engulfing pattern,
It seems that K6 will accelerate to crash the support line.
So, I stop loss at K5.
And Wait for other chances to buy in.
If K6 failed to close below the support,
the potential downtrend will not be able to establish or expand.
Note
After a bearish engulfing pattern (K1 and K2),
K3 hadn’t accelerating,
The support line or 0.382 fib line is still in effect.
So, it is still worth to buy in.
If the following candles couldn’t close below the support line,
Or even break up K3.
I will try to buy back.
Note
K3 is breaking up K0 and the historic highest price.
So, I bought back at about 4.16 USD.
Note
K1 failed to break up, K2 verified a short term downtrend.
The supply pressure sharply dropped to the lowest level.
It is likely that K3 will test the 0.5fib line,
And then, another bull run start immediately.
If K3 break up K2, it is still worth to buy in.
Disclaimer
The information and publications are not meant to be, and do not constitute, financial, investment, trading, or other types of advice or recommendations supplied or endorsed by TradingView. Read more in the Terms of Use.
Disclaimer
The information and publications are not meant to be, and do not constitute, financial, investment, trading, or other types of advice or recommendations supplied or endorsed by TradingView. Read more in the Terms of Use.