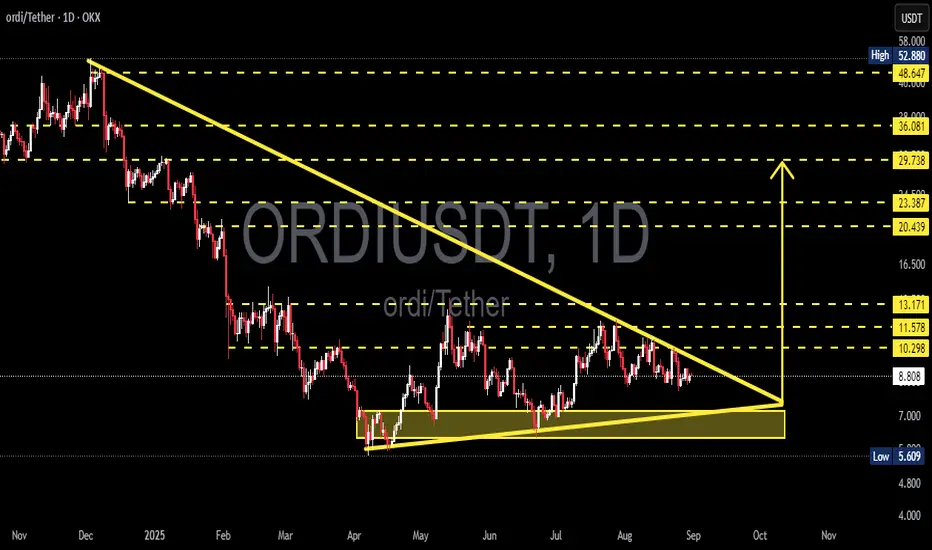
Currently, ORDI/USDT is consolidating tightly after a prolonged downtrend from the 52.880 peak. The chart is showing a symmetrical triangle, with a descending trendline pressing from above and a rising support line holding from below.
This pattern reflects a compression phase — volatility is narrowing, momentum is being stored, and a major breakout is likely to occur soon.
---
🔎 Pattern & Structure Details
Main trend: Long-term bearish since Dec 2024 (consistent lower highs).
Key support zone: 5.61 – 7.00 (highlighted yellow box), tested multiple times since April.
Key resistance zone: Descending trendline + horizontal resistance around 10.298.
Volatility: Shrinking significantly — the price is moving closer to the apex of the triangle, where breakouts usually happen with strong volume.
---
🟢 Bullish Scenario
1. Breakout confirmation: Daily close above 10.30 with high volume (clear break of descending trendline).
2. Initial targets: 11.58, then 13.17.
3. Extended targets (mid-term): If momentum continues, possible rally toward 20.43 – 23.38.
4. Risk Management: Place stop-loss below 8.0 or under the retest level in case of a false breakout.
---
🔴 Bearish Scenario
1. Breakdown confirmation: Daily close below 7.00 (falling out of the accumulation zone).
2. Initial target: 5.61 support.
3. If 5.61 breaks: Price could extend lower into the 4.0 – 5.0 psychological zone.
4. Risk Management: Stop-loss can be placed above 8.5 – 9.0 to avoid fake breakdowns.
---
⚖️ Conclusion
Neutral outlook until breakout: Symmetrical triangles are statistically neutral, but since it formed inside a broader downtrend, bearish continuation probability is slightly higher.
However, a breakout above resistance with strong volume could trigger a trend reversal and bring back mid-term bullish momentum.
Best approach: wait for confirmed breakout (daily close + volume) before taking positions.
---
ORDI is consolidating inside a symmetrical triangle. Key support zone: 5.61 – 7.00, key resistance: 10.30. The next breakout will set the direction:
🚀 Bullish: Break above 10.30 → targets 11.58, 13.17, even 20+.
🔻 Bearish: Drop below 7.00 → target 5.61, possibly 4.0.
Volatility is tightening — expect a big move soon. Trade with risk management, avoid FOMO.
#ORDI #ORDIUSDT #Crypto #PriceAction #Breakout #TechnicalAnalysis
✅ Get Free Signals! Join Our Telegram Channel Here: t.me/TheCryptoNuclear
✅ Twitter: twitter.com/crypto_nuclear
✅ Join Bybit : partner.bybit.com/b/nuclearvip
✅ Benefits : Lifetime Trading Fee Discount -50%
✅ Twitter: twitter.com/crypto_nuclear
✅ Join Bybit : partner.bybit.com/b/nuclearvip
✅ Benefits : Lifetime Trading Fee Discount -50%
Disclaimer
The information and publications are not meant to be, and do not constitute, financial, investment, trading, or other types of advice or recommendations supplied or endorsed by TradingView. Read more in the Terms of Use.