Long
$OSB daily #chart with ascending triangle #breakout
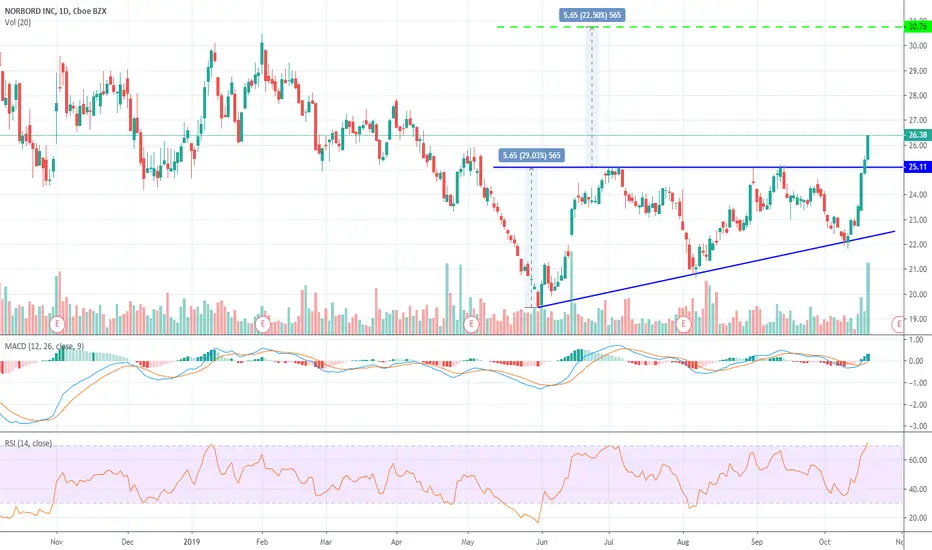
Last week stock has been bought aggressively as seen on the volume chart and managed to breakout the resistance at 25.11
RSI is slightly being pushed now into high levels so ideally could wait for a successful retest of that line, but somehow I have the feeling this could be related to ER on the 31st OCT
Anyway the measured target is at 30.76
Good Luck,
TA
Trade closed: target reached
Target reached,Congrats longs,
TA
Disclaimer
The information and publications are not meant to be, and do not constitute, financial, investment, trading, or other types of advice or recommendations supplied or endorsed by TradingView. Read more in the Terms of Use.
Disclaimer
The information and publications are not meant to be, and do not constitute, financial, investment, trading, or other types of advice or recommendations supplied or endorsed by TradingView. Read more in the Terms of Use.