This chart presents a detailed Ichimoku-based forecast for the altcoin market (Crypto Total Market Cap excluding top 10). Several technical and cyclical factors converge to suggest that mid-to-late September 2025 could mark a significant pivot high — potentially launching a strong move for alts.
🔹 Key Technical Observations:
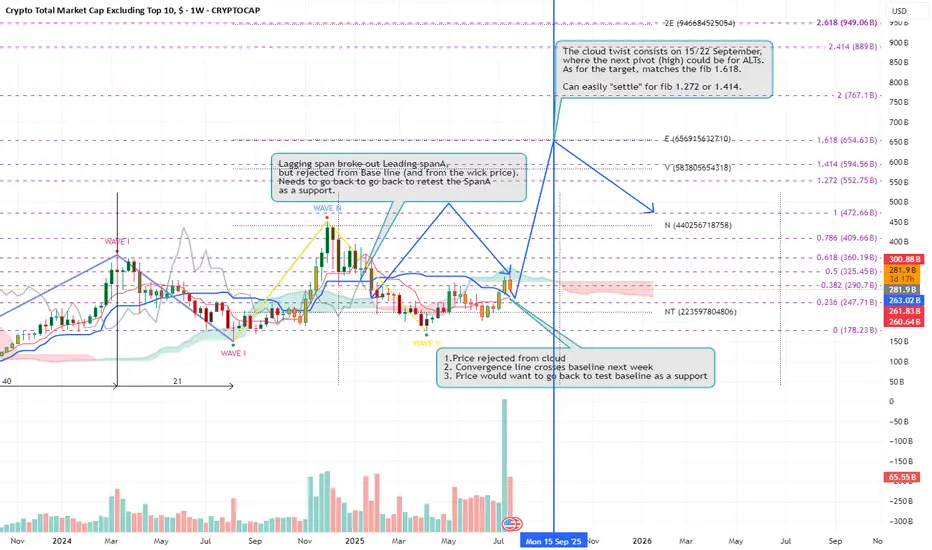
Price rejected from the cloud and currently pulling back after an overextended move.
Tenkan (conversion) line expected to cross the Kijun (base) line next week, which typically indicates a trend decision point.
Price may retest the baseline as support before continuing higher — a healthy bullish retest scenario.
Lagging Span broke above Span A but faced rejection from the Base Line — reinforcing the idea of a necessary retest.
Kumo Twist occurs on Sept 15–22, historically a strong pivot signal (trend reversal or acceleration).
Fibonacci confluence zones project potential upside targets aligning with Fib 1.272–1.618 zones:
Conservative: 1.272 = $552B
Aggressive: 1.618 = $654B
These align with key historical reaction levels and Ichimoku projections.
Interpretation:
We may see a short-term pullback toward the Kijun, after which a strong bullish continuation becomes likely — especially if supported by macro liquidity or BTC.D rotation. The confluence of Ichimoku time theory, wave structure, and Fibonacci extensions suggests that the next major high in ALTs could occur around September 15–22, as the Kumo Twist aligns with wave count and momentum shift.
Trade Implication:
Use dips as buying opportunities as long as the Baseline holds. Expect volatility before the September pivot window, which may mark the next explosive move.
📅 Watch these levels:
Support: 263B (0.382 Fib), 281B (Kijun)
Resistance/Target: 360B (0.618), 440B (Fib 1.0), 552B–654B (1.272–1.618 targets)
This analysis is for educational purposes only. It does not constitute financial advice. Always do your own research (DYOR) and consult with a professional before making investment decisions. Markets involve risk, and past performance does not guarantee future results.
🔹 Key Technical Observations:
Price rejected from the cloud and currently pulling back after an overextended move.
Tenkan (conversion) line expected to cross the Kijun (base) line next week, which typically indicates a trend decision point.
Price may retest the baseline as support before continuing higher — a healthy bullish retest scenario.
Lagging Span broke above Span A but faced rejection from the Base Line — reinforcing the idea of a necessary retest.
Kumo Twist occurs on Sept 15–22, historically a strong pivot signal (trend reversal or acceleration).
Fibonacci confluence zones project potential upside targets aligning with Fib 1.272–1.618 zones:
Conservative: 1.272 = $552B
Aggressive: 1.618 = $654B
These align with key historical reaction levels and Ichimoku projections.
Interpretation:
We may see a short-term pullback toward the Kijun, after which a strong bullish continuation becomes likely — especially if supported by macro liquidity or BTC.D rotation. The confluence of Ichimoku time theory, wave structure, and Fibonacci extensions suggests that the next major high in ALTs could occur around September 15–22, as the Kumo Twist aligns with wave count and momentum shift.
Trade Implication:
Use dips as buying opportunities as long as the Baseline holds. Expect volatility before the September pivot window, which may mark the next explosive move.
📅 Watch these levels:
Support: 263B (0.382 Fib), 281B (Kijun)
Resistance/Target: 360B (0.618), 440B (Fib 1.0), 552B–654B (1.272–1.618 targets)
This analysis is for educational purposes only. It does not constitute financial advice. Always do your own research (DYOR) and consult with a professional before making investment decisions. Markets involve risk, and past performance does not guarantee future results.
Disclaimer
The information and publications are not meant to be, and do not constitute, financial, investment, trading, or other types of advice or recommendations supplied or endorsed by TradingView. Read more in the Terms of Use.
Disclaimer
The information and publications are not meant to be, and do not constitute, financial, investment, trading, or other types of advice or recommendations supplied or endorsed by TradingView. Read more in the Terms of Use.