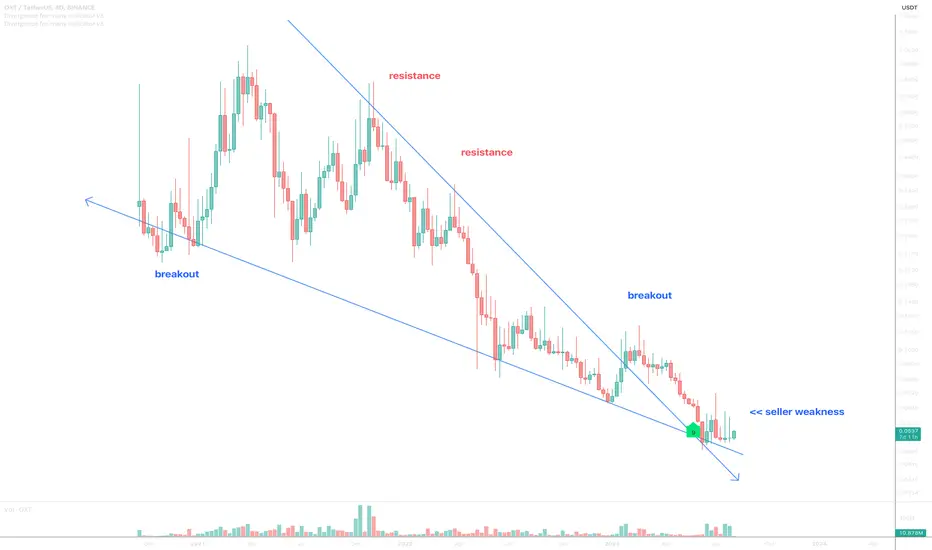
On the above 8-day chart price action has corrected by 95% since the sell signal (will show elsewhere). Today is great long opportunity. Why?
1) RSI and price action resistance breakout.
2) Multiple oscillators print bullish divergence across a 3-month period.
3) Seller weakness. Notice the long candle wicks into seller territory?
4) Price action prints support on past resistance since breakout. Look left.
Is it possible price action falls further? Sure.
Is it probable? No.
Ww
Type: trade
Risk: <=6% of portfolio
Timeframe: Now, don’t sit on your hands.
Return: Will say elsewhere.
Trade active
Support confirmed.Note
50% in 4 days.Note
Can you see the next token about to repeat the performance of OXT these past few days? It is only other token listed on Binance currently printing like OXT from a week ago.Hint.. perhaps I've already published it.
Trade active
Note
As before expect resistance at 9 cents. Long again from 6-7 cents.Trade active
Note
excellent long momentNote
See the breakout and near term target? Easy as pie.Daily chart
Note
Hold until 70 cents.Note
Weekly life cross prints.Weekly
Trade active
Past resistance confirms support.BTC
bc1q2eckdzh0q8vsd7swcc8et6ze7s99khhxyl7zwy
Weblink: patreon.com/withoutworries
Allow 3-6 months on ideas. Not investment advice. DYOR
bc1q2eckdzh0q8vsd7swcc8et6ze7s99khhxyl7zwy
Weblink: patreon.com/withoutworries
Allow 3-6 months on ideas. Not investment advice. DYOR
Disclaimer
The information and publications are not meant to be, and do not constitute, financial, investment, trading, or other types of advice or recommendations supplied or endorsed by TradingView. Read more in the Terms of Use.
BTC
bc1q2eckdzh0q8vsd7swcc8et6ze7s99khhxyl7zwy
Weblink: patreon.com/withoutworries
Allow 3-6 months on ideas. Not investment advice. DYOR
bc1q2eckdzh0q8vsd7swcc8et6ze7s99khhxyl7zwy
Weblink: patreon.com/withoutworries
Allow 3-6 months on ideas. Not investment advice. DYOR
Disclaimer
The information and publications are not meant to be, and do not constitute, financial, investment, trading, or other types of advice or recommendations supplied or endorsed by TradingView. Read more in the Terms of Use.